MBA Chart of the Week Mar. 31, 2023: Housing Cost Burden Rates by Income Level
MBA’s Purchase Applications Payment Index data show that the steep rise in interest rates dominated moderating mortgage application loan amounts and in 2022 and early 2023, indicating eroded affordability for new homebuyers. Similarly, affordability for renters declined with U.S. Census Bureau data showing that median asking rents jumped by over 9.5% between the fourth quarters of 2021 and 2022.
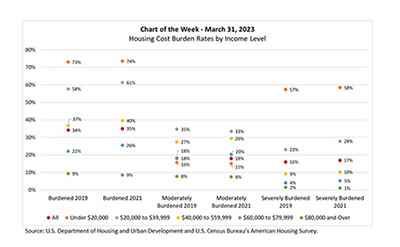
In this week’s MBA Chart of the Week, we look at housing cost ratios by household income level, using data from the 2021 American Housing Survey. By defining a household as cost burdened when its housing costs to income ratio is greater than 30%, we see that 35% of households in the U.S. were burdened in 2021 (second column from the left, red dot). Compared to the AHS data from 2019, the proportion of burdened households increased by one percentage point (first column, red dot).
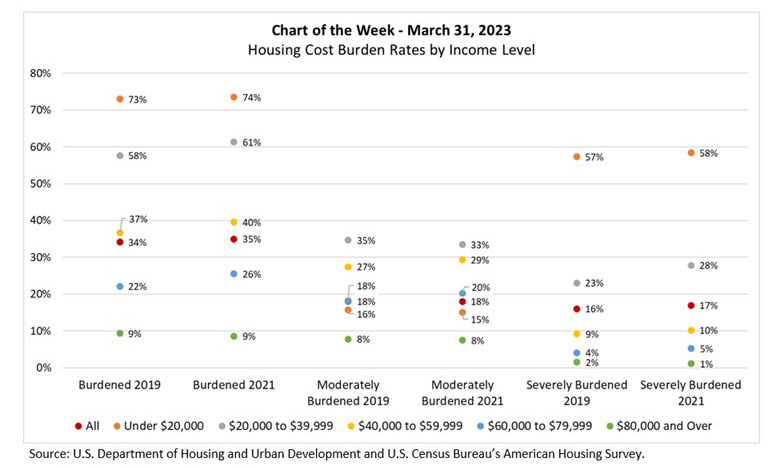
The chart also shows that income levels are a key driver of housing cost burden, and that burden increases between 2019 and 2021 were not evenly distributed across income levels. Cost burden increases were largest for medium income households (e.g., for households making $60,000 to $79,999 (blue dots) the burden rate increased from 22% to 26% between 2019 and 2021).
Of the households who were burdened in 2021, over half were moderately burdened (i.e., their HCIR was between 30% and 50%) and just under half were severely burdened, with an HCIR greater than 50% (see the red dots in the fourth and sixth columns). However, lower income households are far more likely to face severe housing cost burdens than are other households. This is particularly true for those earning less than $20,000 (orange dots in the last two columns).
MBA’s latest mortgage market forecast shows that fixed-rate 30-year interest rates are predicted to decrease to 5.3% in 2023 and the median sales price (for existing and new home sales) is forecast to be lower at the end of 2023 than it was at the end of 2022. Taking these together— absent a large decrease in average weekly earnings – we forecast that the PAPI will decrease in 2023, indicating increased affordability for new homebuyers.
–Edward Seiler eseiler@mba.org; Joel Kan jkan@mba.org.