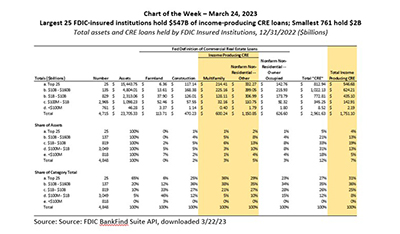
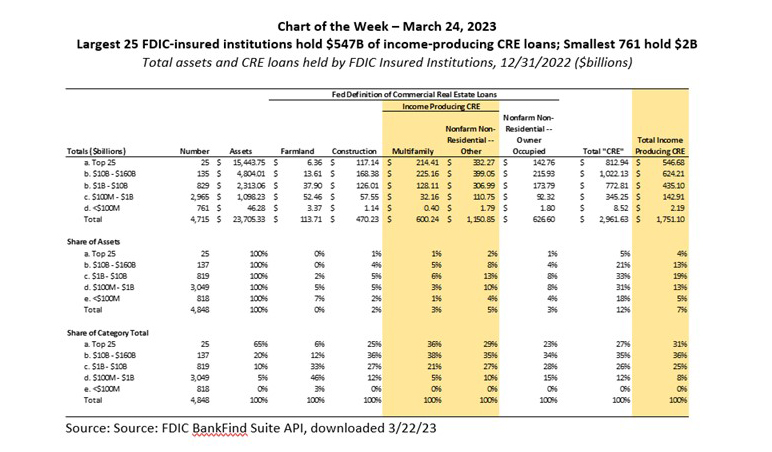
MBA Chart of the Week, Mar. 24, 2023: CRE Loans/FDIC-Insured Institutions
There is, not inappropriately, a great deal of attention being paid to commercial real estate right now. And with that attention come a lot of different questions and answers—with many answers varying depending on how one defines things.
One reference that we have been getting a lot of questions about is the second sentence in a recent high-profile news story that stated, “Smaller banks hold around $2.3 trillion in commercial real estate debt, including rental-apartment mortgages… almost 80% of commercial mortgages held by all banks.”
Many Federal Reserve data series for CRE include not just loans backed by income-producing CRE (think apartments, office, retail, industrial, and other properties for which owners charge rents for people’s or firm’s use of the space), but also construction and development loans (which includes a large share of loans backing construction of single-family and for-sale homes), loans backed by farmland, and loans collateralized by owner-occupied properties (which are generally C&I loans with the extra protection of real estate but no reliance on rents, leases and the like). In most MBA data, we try to strip out these other categories to focus on income producing CRE, which is what we think most market participants generally mean when talking about the CRE market.
Based on the latest Q4 2022 call report data (summarized in the chart above) from the Federal Deposit Insurance Corporation (FDIC), the total amount of mortgage debt backed by income-producing CRE properties held by all FDIC-insured institutions was $1.75 trillion, versus $2.9 trillion using the broader definition. When looking beyond banks to the broader commercial real estate finance market, this same distinction results in totals of $5.6 trillion in CRE mortgage debt outstanding by the Fed definition and $4.4 trillion of CRE mortgage debt backing income-producing properties.
When it comes to reporting on “smaller banks,” some Fed data series (e.g., its H8 data) classify the largest 25 banks as “large” and the remaining 4600+ as “small.” Digging into the Call Report data, at the end of 2022, the largest 160 banks held almost $1.2 trillion of income-producing CRE mortgage debt, leaving less than $600 billion (33% of the total) at the remaining 4500+ FDIC-insured institutions.
Given current market conditions, there are also an increasing number of estimates of the volume of that loans will be maturing this year and in coming years. We presented our take on that data couple of weeks ago.
There is great value in having a variety of different data series and options for understanding what is happening in the markets. From many of the questions we are receiving, some of the differences between these series are leading to confusion. Please let us know if we can help you sort things out.
—Jamie Woodwell jwoodwell@mba.org.