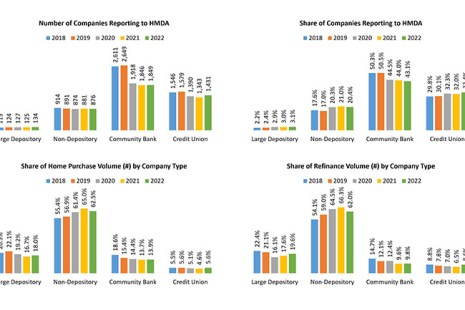
A total of 4,290 companies reported lending activity under the Home Mortgage Disclosure Act (HMDA) in 2022, according to MBA’s analyses of the dataset.
Tag: MBA Chart of the Week
MBA Chart of the Week July 24: Divergence Between Existing and New Home Sales
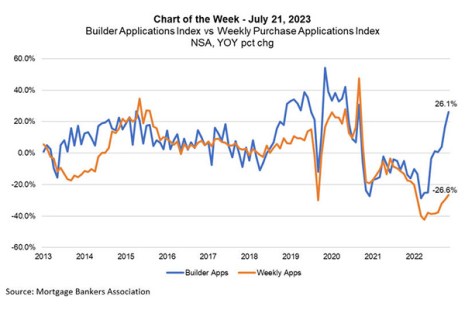
The divergence between existing and new home sales activity continues to grow.

MBA Chart of the Week July 24, 2023
The divergence between existing and new home sales activity continues to grow. This MBA Chart of the Week compares data from our Builder Applications Survey, which captures home purchase applications on newly constructed homes taken by mortgage companies affiliated with home builders, and the Weekly Applications Survey, which covers a broader sample of lenders who originate loans in the retail and consumer direct channels.
MBA Chart of the Week July 17, 2023: IMB Production Expenses Vs. Gross Production Expenses
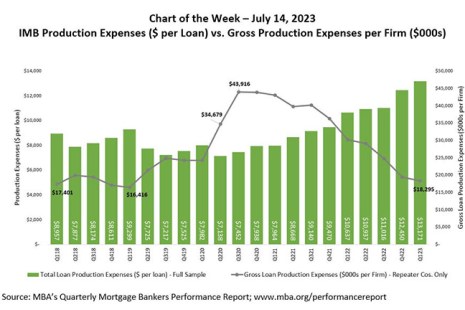
In May, MBA Research released the first quarter results of its Quarterly Mortgage Bankers Performance Report (QPR). Total loan production expenses – commissions, compensation, occupancy, equipment, and other production expenses and corporate allocations – increased to a study-high of $13,171 per loan in the first quarter.
MBA Chart of the Week July 10, 2023
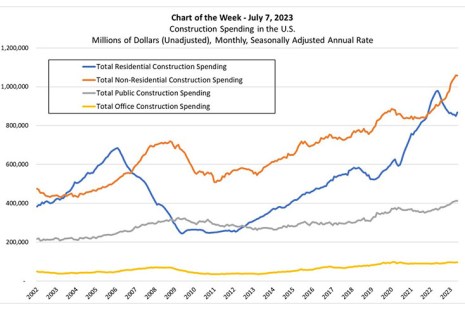
The U.S. Census Bureau released updated construction spending survey data. Also referred to as the Value of Construction Put in Place, the survey covers all private residential construction and improvements, non-residential construction, and public construction.

MBA Chart of the Week July 10, 2023
The U.S. Census Bureau released updated construction spending survey data. Also referred to as the Value of Construction Put in Place, the survey covers all private residential construction and improvements, non-residential construction, and public construction.
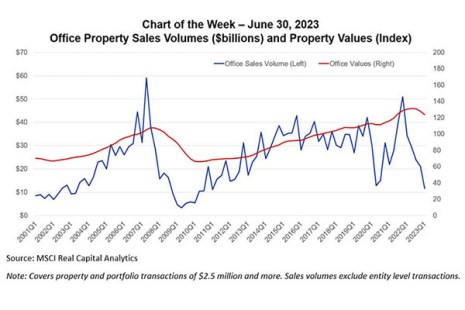
MBA Chart of the Week July 3, 2023: Office Property Sales Volumes and Values
In commercial real estate, all eyes remain on the office market. That is despite the fact that multifamily mortgage debt – accounting for $2.0 trillion of the $4.6 trillion of total outstanding — is almost three times as large and office accounts for just 17 percent of total CRE debt.
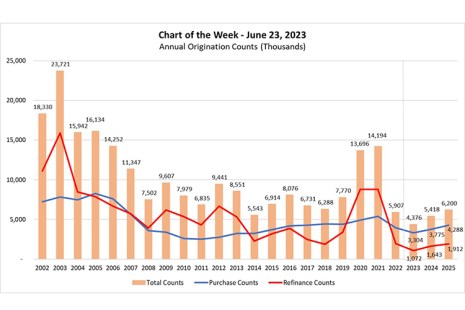
MBA Chart of the Week June 26, 2023: Annual Origination Counts
2020 and 2021 were record setting years with $4.11 trillion and $4.44 trillion in originations respectively, as the industry experienced record low mortgage rates and home price appreciation soared across the country.

MBA Chart of the Week June 26, 2023: Annual Origination Counts
2020 and 2021 were record setting years with $4.11 trillion and $4.44 trillion in originations respectively, as the industry experienced record low mortgage rates and home price appreciation soared across the country.

