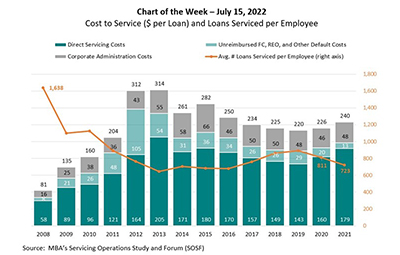
MBA’s annual Servicing Operations Study and Forum includes a deep-dive analysis and discussion of servicing costs, productivity, portfolio activity and operational metrics for in‐house servicers. This week’s MBA Chart of the Week shows 2021 fully loaded servicing costs, which include three components: direct expenses; unreimbursed foreclosure, REO and other default costs; and corporate administration costs.
Tag: MBA Chart of the Week
MBA Chart of the Week July 8, 2002: Retail Loan Officer Productivity
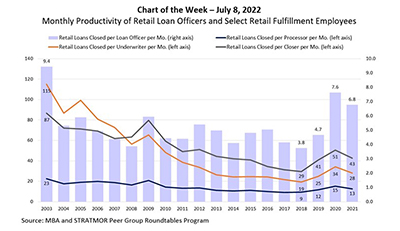
In this week’s Chart of the Week, we turn to data from the longstanding MBA and STRATMOR Peer Group Roundtables Program), which recently wrapped up its Spring season for benchmarking lender performance across various production channels and peer groups.
MBA Chart of the Week July 8, 2002: Retail Loan Officer Productivity
In this week’s Chart of the Week, we turn to data from the longstanding MBA and STRATMOR Peer Group Roundtables Program), which recently wrapped up its Spring season for benchmarking lender performance across various production channels and peer groups.
MBA Chart of the Week July 1, 2022: Projected Excess Supply of Housing from the Aging of Baby Boomers
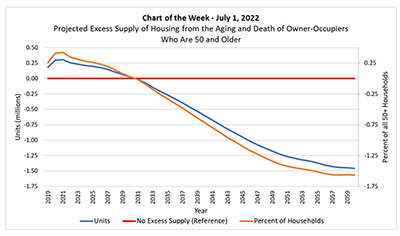
The Research Institute for Housing America, MBA’s think tank, released a special report, “Who Will Buy the Baby Boomers’ Homes When They Leave Them?”, authored by Gary Engelhardt of Syracuse University. The report examines population aging, mortality and the future of the housing market.
MBA Chart of the Week July 1, 2022: Projected Excess Supply of Housing from the Aging of Baby Boomers
The Research Institute for Housing America, MBA’s think tank, released a special report, “Who Will Buy the Baby Boomers’ Homes When They Leave Them?”, authored by Gary Engelhardt of Syracuse University. The report examines population aging, mortality and the future of the housing market.
MBA Chart of the Week June 24, 2022: Median Payment by Conventional/Government Loan
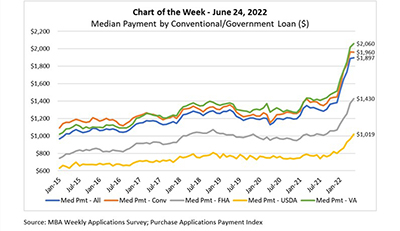
The national median mortgage payment was $1,897 in May, a slight increase from $1,889 in April and $572 higher than in May 2021, according to this week’s Purchase Applications Payment Index release.
MBA Chart of the Week June 24, 2022: Median Payment by Conventional/Government Loan
The national median mortgage payment was $1,897 in May, a slight increase from $1,889 in April and $572 higher than in May 2021, according to this week’s Purchase Applications Payment Index release.
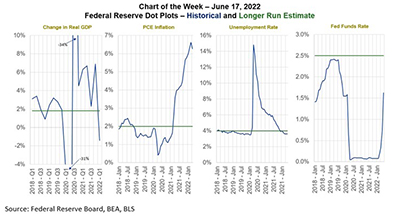
MBA Chart of the Week June 17 2022: Federal Reserve Projections
The Federal Reserve is racing to catch up to economic events, announcing a 75-basis-point increase in the federal funds rate and signaling more increases following last week’s FOMC meeting.
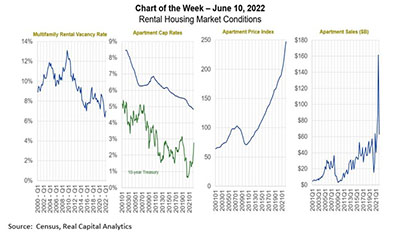
MBA Chart of the Week, June 10, 2022: Rental Housing Market Conditions
Commercial and multifamily real estate – after years of strong and steady growth – is in a period of transition, driven by changes in the space, equity and debt markets.
MBA Chart of the Week, June 10, 2022: Rental Housing Market Conditions
Commercial and multifamily real estate – after years of strong and steady growth – is in a period of transition, driven by changes in the space, equity and debt markets.