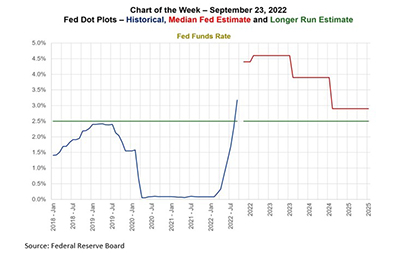
In response to inflation continuing to run well above its target of 2%, the Federal Reserve this week again raised the federal funds target by 75 basis points. Now at 3%, the rate above what most FOMC members consider to be the long-term level and should be effective in reducing demand and slowing inflation over time.
Tag: MBA Chart of the Week
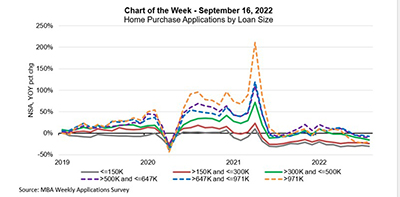
MBA Chart of the Week, Sept. 16, 2022: Home Purchase Applications by Loan Size
The housing market continues to face challenges from economic uncertainty, high home-price growth and volatile mortgage rates. MBA’s Weekly Applications Survey data show that overall mortgage application activity continues to trend lower, as refinances have quickly dried up due to rates rising throughout the year and hitting the 6-percent mark for the first time since 2008.
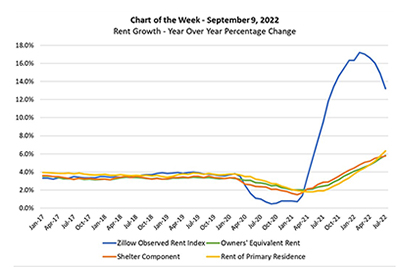
MBA Chart of the Week: Rent Growth–Year-over-Year Percentage Change
This week’s MBA Chart of the Week highlights a question related to housing costs and inflation: If home price appreciation and rent growth have been in double digits in the past few quarters—as highlighted by the (blue lined) Zillow Observed Rent Index in the chart—why is the shelter component (orange line) of the Consumer Price Index below 6%?
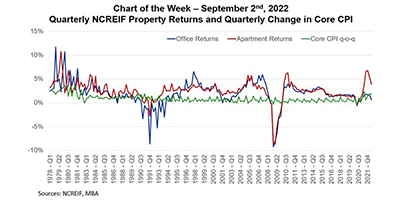
MBA Chart of the Week: Quarterly NCREIF Property Returns
The forward path of inflation remains a topic of great debate and conjecture. How that path plays into the relative benefits of different investment options – including commercial real estate and other real assets – will give us even more insights into the relationship.
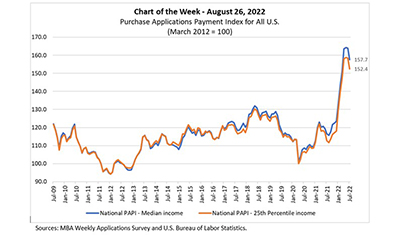
MBA Chart of the Week, Aug. 26, 2022: MBA Purchase Applications Payment Index
In this MBA Chart of the Week, we examine how market transitions are affecting homebuyer affordability.
MBA Chart of the Week, Aug. 26, 2022: MBA Purchase Applications Payment Index
In this MBA Chart of the Week, we examine how market transitions are affecting homebuyer affordability.