MBA Chart of the Week: Rent Growth–Year-over-Year Percentage Change
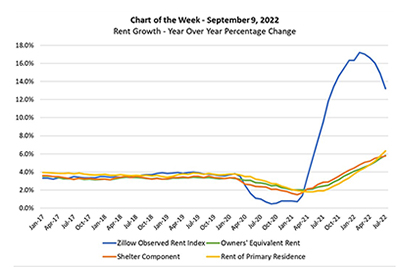
This week’s MBA Chart of the Week highlights a question related to housing costs and inflation: If home price appreciation and rent growth have been in double digits in the past few quarters—as highlighted by the (blue lined) Zillow Observed Rent Index in the chart—why is the shelter component (orange line) of the Consumer Price Index below 6%?
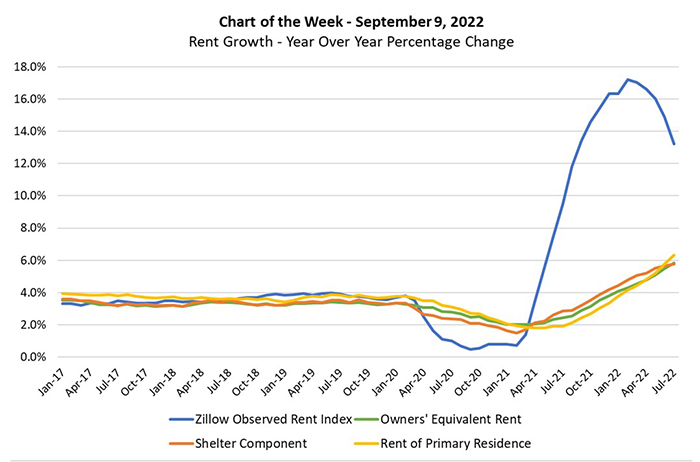
The main reason that the shelter component of the CPI (and its main components—owners’ equivalent rent for homeowners (green line) and rent of primary residence for renters (yellow line)) has risen more modestly than the ZORI, a repeat-rent index, is that the CPI housing components measure rent changes for all housing units, while rent indexes track the change in rent for new leases.
As described in a recent research report from Apartment List: “[O]nly a small fraction of households sign a new or renewal lease in any given month, while the large majority of households see no change in their housing costs. As a result, housing price changes will always appear more muted when considering all households rather than only those who signed new leases.”
The chart can also be used to help predict how the shelter component of inflation will evolve. As John Cochrane, The Grumpy Economist (who taught me my first macroeconomic class in graduate school), writes when analyzing a similar chart: “Inflation should not be a surprise to forecasters. If you see rents on new leases much above average rents, it’s a pretty good bet that average rents will be rising in the future!” Indeed, his message is well heeded. A Fannie Mae Housing Insight blog from 2021 discusses how the lagged effects of HPA and rent growth flow into inflation measures, and in this vein, the Apartment List report posits that decelerating rent indices suggest that the rent CPI should start to fall by the end of the year. MBA Research is also tracking housing inflation closely.
We are forecasting HPA will be in single digits by the end of the year (9.9%), and that inflation will be 1.8% lower than the 8.5% reported in July. The August CPI—to be released on Tuesday—will provide more details.