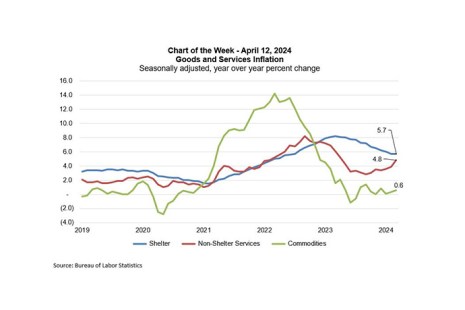
The week’s news has been around the Consumer Price Index (CPI) release showing that inflation was hotter than expected in March, which is likely to delay the Federal Reserve’s first rate cut in 2024 and contributed to a significant spike in the 10-year Treasury yield to over 4.5%.
Tag: Consumer Price Index
Inflation Slows to Two-Year Low
Consumer prices rose by 0.4 percent in April to 4.9 percent annually, the slowest annual inflation rate since April 2021, the Bureau of Labor Statistics reported Wednesday.
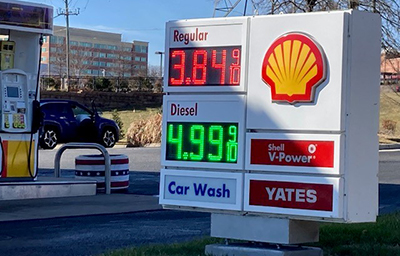
Inflation Slows to 5% as Energy Prices Tumble
The Consumer Price Index continued its slowing trend in March, rising by just 0.1 percent from February and by 5 percent from a year ago, the Bureau of Labor Statistics reported Wednesday.
Inflation Rate Continues to Slow…Slowly
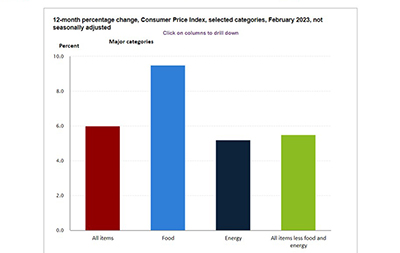
The federal government’s key measure of inflation—the monthly Consumer Price Index—continued to slow in February, albeit not by much.
January Consumer Prices Rise; Not Out of Woods Yet
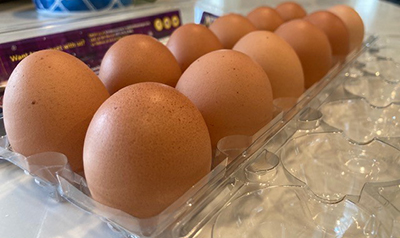
Consumer prices rose by 0.5 percent in January and by 6.4 percent annually, the Bureau of Labor Statistics reported Tuesday, as rising food and energy prices reminded consumers that inflation—while well down from its earlier peak—is taking its time getting back to normal.
Inflation Takes Step Back
Inflation—a highly regarded component of Federal Reserve policy—declined in December and slowed on an annual basis, the Bureau of Labor Statistics reported Thursday.
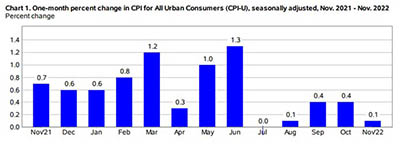
November CPI Posts Welcome ‘Modest’ Increase
It’s not often that “modest” has economic significance, but when it refers to inflation as of late, then “modest” is perhaps a welcome description.
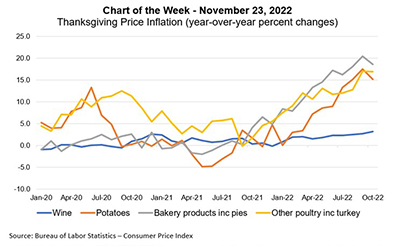
MBA Chart of the Week: Thanksgiving Price Inflation
Our Thanksgiving edition of Chart of the Week focuses on four major food and beverage items popular for the occasion – turkey, potatoes, baked goods and wine. Consistent with the broader inflationary environment, prices for these products, as measured by the Consumer Price Index have seen significant growth over the past year.
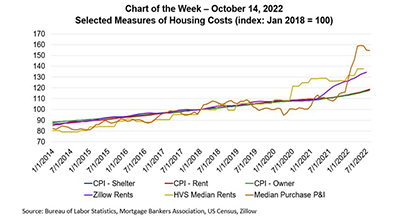
MBA Chart of the Week Oct. 14 2022: Housing Costs
This week’s Chart of the Week highlights different measures of housing costs, all indexed to 2018. The lowest lines are the CPI measures of shelter costs, including the “’all-in” shelter measure and breakouts for rents and owners’ equivalent rents.
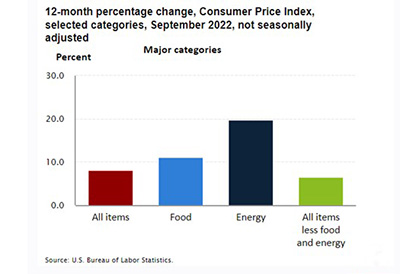
Economic Report Roundup: Inflation Pushes Up; Initial Claims Rise
The Bureau of Labor Statistics on Thursday reported its Consumer Price Index rose by 0.4 percent in September to an annual rate of 8.2 percent. Separately, the Labor Department reported initial claims for unemployment insurance rose for the second straight week.