The U.S. homeownership rate rose to 65.8 percent in the second quarter, matching its highest rate since 2020, the Census Bureau reported this week.
Tag: Census Bureau
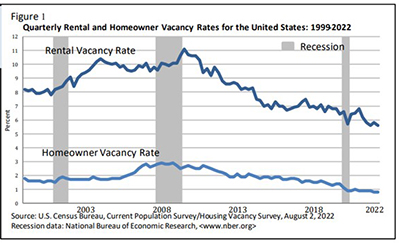
U.S. Homeownership Rate at 2-Year High
The U.S. homeownership rate rose to 65.8 percent in the second quarter, matching its highest rate since 2020, the Census Bureau reported this week.
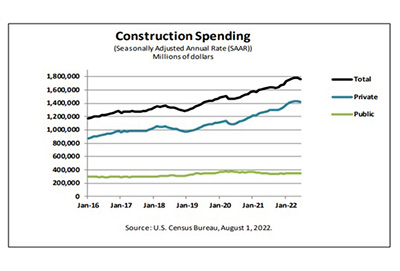
June Construction Spending Down; Manufacturing Slows
Construction spending in June fell by more than 1 percent from May, the Census Bureau reported Monday. In a separate report, Institute for Supply Management, Tempe, Ariz., said its Manufacturing Index fell by 0.2 percent to a nearly two-year low.
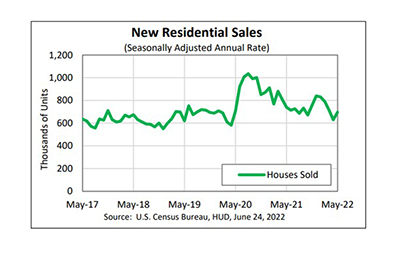
May New Home Sales Jump 11%
May new home sales proved to be a solitary bright spot in a month of otherwise disappointing housing reports, rising by nearly 11 percent from April, HUD and the Census Bureau reported Friday.
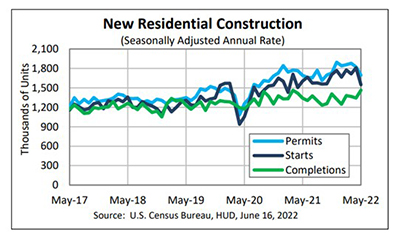
May Housing Starts Plunge Amid Market Volatility
Housing starts fell sharply in May, HUD and the Census Bureau reported Thursday, as continued market volatility and higher interest rates took a toll on both consumers and home builders.
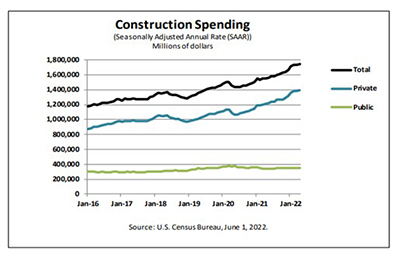
April Construction Edges Up
Construction spending improved slightly in April, by 0.2 percent from March—but below expectations., the Census Bureau reported Wednesday.

8 of 10 Largest U.S. Cities Lose Population; Sun Belt Grows
Sun Belt cities have benefited from U.S. population shifts over the past several decades, the Census Bureau reported this month; new data show the top 15 fastest-growing U.S. cities are entirely in the South and West.

April New Home Sales Fall to 2-Year Low
New home sales in April suffered double-digit percentage losses for the second consecutive month, falling to their lowest level since June 2020, HUD and the Census Bureau reported Tuesday.
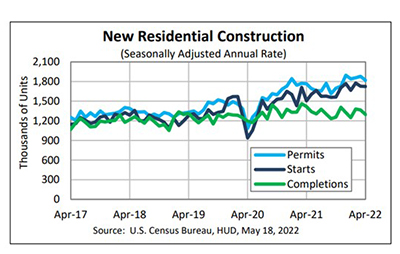
Multifamily Nearly—But Not Quite—Saves April Housing Starts
April housing starts fell by just 0.2 percent from March—no thanks to single-family starts, which fell by more than 7 percent—HUD and the Census Bureau reported Wednesday.
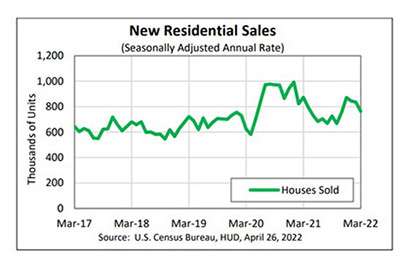
March New Home Sales Stumble
New home sales took a tumble in March, HUD and the Census Bureau reported Tuesday, hamstrung by the usual suspects: rising interest rates; inadequate inventories and rapidly increasing home prices.