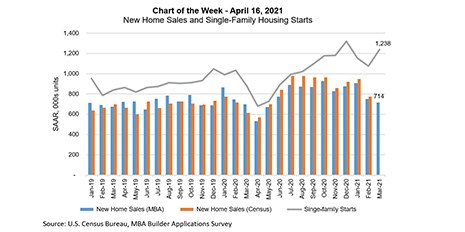
This week’s MBA Chart of the Week focuses on newly built homes, as measured by new home sales and single-family housing starts.
Tag: Census Bureau
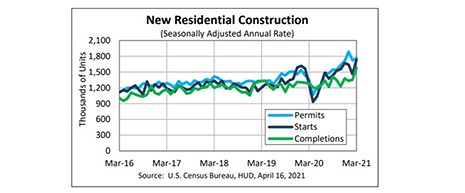
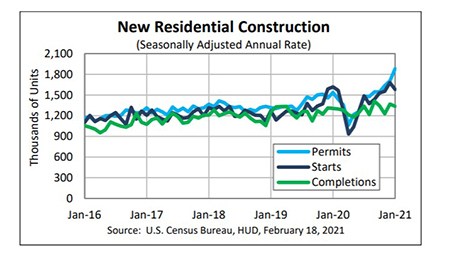
March Housing Starts Post at Highest Rate in 15 Years
Housing starts recovered from a sluggish February to its highest rate since 2006 in March, HUD and the Census Bureau reported Friday.

New Home Sales Take a February Hit
Historically, February has never been a big month for home sales—it’s cold, the weather is unpredictable and it’s, well, February. But during the hottest—and strangest—housing winter in memory, could this February also defy logic.
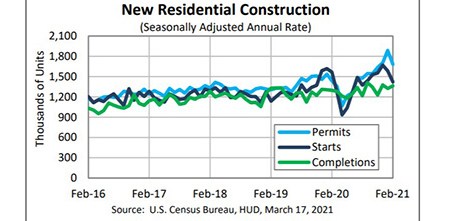
Winter Catches Up with February Housing Starts
Housing starts fell in February for the second straight month, HUD and the Census Bureau reported yesterday, with winter weather largely the culprit.
2021 New Home Sales Off to Solid Start
The report said sales of new single-family houses in January rose to a seasonally adjusted annual rate of 923,000, 4.3 percent higher than the revised December rate of 885,000 and 19.3 percent higher than a year ago (774,000).
Despite January Pullback, Housing Starts Remain Strong
After a terrific December, January housing starts, as expected, fell back a bit but maintained a strong pace, HUD and the Census Bureau reported yesterday.
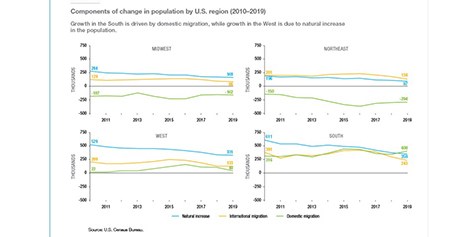
Freddie Mac: South, West Populations Growing 7X Faster than Rest of U.S.
Freddie Mac, McLean, Va., reported the U.S. population in the South and West grew seven times faster than in the Northeast and Midwest between 2017 and 2019.
December New Home Sales Post Modest Increase
New home sales rose by 1.6 percent in December—slightly less than consensus expectations, HUD and the Census Bureau reported yesterday.
Housing Starts Finish 2020 on Strong Note
Housing starts rose for the second straight month in December and finished the year at its strongest pace since 2006, HUD and the Census Bureau reported yesterday.
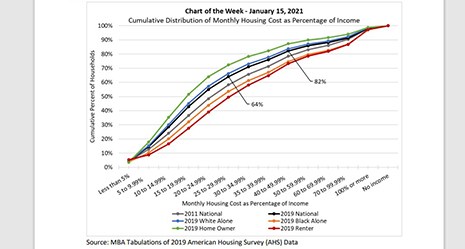
MBA Chart of the Week: Monthly Housing Cost as Percentage of Income
This week’s MBA Chart of the Week uses AHS data to show the distribution of total monthly housing costs as a percentage of income. T