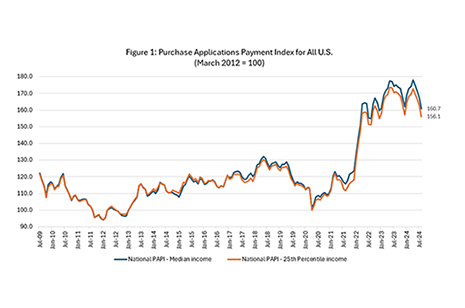
Homebuyer affordability improved in August, with the national median payment applied for by purchase applicants decreasing to $2,057 from $2,140 in July. This is according to MBA’s Purchase Applications Payment Index.
Tag: Research Institute for Housing America

Cushman: Now is the Time to Fight Climate Change
As sea levels rise, the reality of climate change’s impact on the commercial real estate industry is becoming clearer, reported Cushman & Wakefield, Chicago.

RIHA Releases Second Collection of Essays on Climate Change’s Impact on Real Estate Finance
The Mortgage Bankers Association’s Research Institute for Housing America published a second collection of essays that addresses affects of climate change on the real estate finance industry.
RIHA Releases Second Collection of Essays on Climate Change’s Impact on Real Estate Finance
The Mortgage Bankers Association’s Research Institute for Housing America published a second collection of essays that addresses affects of climate change on the real estate finance industry.
RIHA Releases Second Collection of Essays on Climate Change’s Impact on Real Estate Finance
The Mortgage Bankers Association’s Research Institute for Housing America published a second collection of essays that addresses affects of climate change on the real estate finance industry.
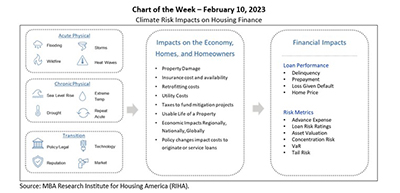
MBA Chart of the Week Feb. 10 2023: Climate Risk and Housing Finance
The Research Institute for Housing America, MBA’s think tank, released the first volume of A Collection of Essays on Climate Risk and the Housing Market that examines various aspects of how climate risk is impacting housing markets (as summarized in this week’s chart that replicates Exhibit 1 from the second essay).

RIHA Releases Collection of Essays on Impact of Climate Change on Real Estate Finance
The Mortgage Bankers Association’s Research Institute for Housing America published a new collection of essays addressing the impacts of climate change on the real estate finance industry.
RIHA Releases Collection of Essays on Impact of Climate Change on Real Estate Finance
The Mortgage Bankers Association’s Research Institute for Housing America published a new collection of essays addressing the impacts of climate change on the real estate finance industry.

RIHA: Boomer Homeowners’ Mortality Expected to Have Minimal Impact on Housing Supply, Prices
More than 4 million existing-homes for sale annually over the next decade will come from the aging and mortality of older homeowners, but sustained homebuyer demand from population growth and younger-generation households should lead to minimal excess housing supply and have no measurable reduction in home prices.
MBA RIHA: Baby Boomer Homeowners’ Mortality Expected to Have Minimal Impact on Housing Supply and Prices
More than 4 million existing-homes for sale annually over the next decade will come from the aging and mortality of older homeowners, but sustained homebuyer demand from population growth and younger-generation households should lead to minimal excess housing supply and have no measurable reduction in home prices.