The Federal Open Market on Wednesday raised the federal funds rate by another 25 basis points, a move widely anticipated by analysts and financial markets.
Tag: Mike Fratantoni

Strong February Job Growth Muddies Fed Outlook
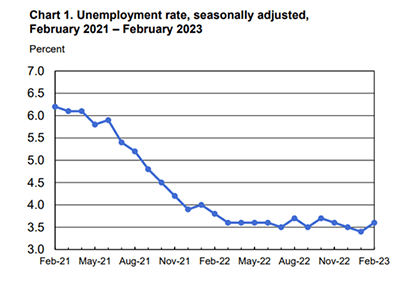
Employers added 311,000 jobs in February, the Bureau of Labor Statistics reported Friday—good news for the labor market but complicating news for the Federal Reserve, which faces the daunting task next week of encouraging economic growth while taming inflation.

Jobs Report: Initial Claims Jump to 5-Week High
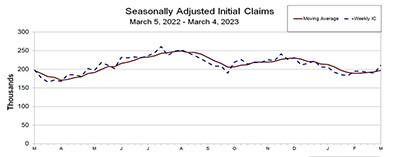
Initial claims for unemployment insurance jumped last week at the fastest pace in five months, with total claims reaching their highest level since December, the Labor Department reported Thursday.

Jobs Reports: Private-Sector Employment Up 242,000; Job Openings Under 11 Million
In the first two of four major jobs reports this week, ADP, Roseland, N.J., said February private-sector employment increased by 242,000, while the Bureau of Labor Statistics reported job openings fell under 11 million.

(#MBAServicing23) Market Outlook: A Few Hurdles Ahead
ORLANDO—The mortgage servicing industry has seen a lot of volatility lately—and that’s not likely to ease up any time soon, said Mortgage Bankers Association economists.

(#MBAServicing23) Market Outlook: A Few Hurdles Ahead
ORLANDO—The mortgage servicing industry has seen a lot of volatility lately—and that’s not likely to ease up any time soon, said Mortgage Bankers Association economists.

MBA Weekly Survey Feb. 22, 2023: Mortgage Applications Decrease
Mortgage applications decreased 13.3 percent from one week earlier, according to data from the Mortgage Bankers Association’s Weekly Mortgage Applications Survey for the week ending February 17, 2023.

#MBACREF23: Ferguson Sees Mild(er) Recession Ahead
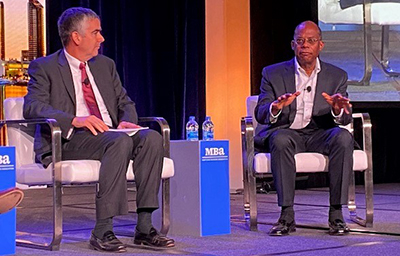
SAN DIEGO–Economist, corporate executive and former Federal Reserve Vice Chairman Roger Ferguson thinks any possible recession this year will likely be short and shallow.

#MBACREF23: Ferguson Sees Mild(er) Recession Ahead
SAN DIEGO–Economist, corporate executive and former Federal Reserve Vice Chairman Roger Ferguson thinks any possible recession this year will likely be short and shallow.

MBA Advocacy Update Feb. 6 2023
On Wednesday, President Joe Biden and House Speaker Kevin McCarthy (R-CA) began face-to-face debt ceiling discussions, with the latter expressing cautious optimism that the two sides can come to a deal to avoid the first-ever default on the nation’s debt obligations.

