MBA Chart of the Week: Warehouse Lines for Loans Held for Sale

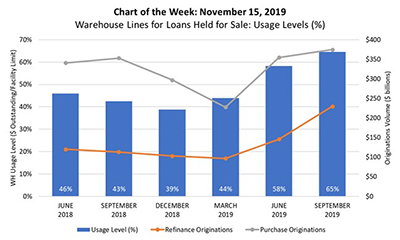
This week’s chart plots quarter-end average warehouse usage levels from inception of the MBA Warehouse Lending Survey in June 2018 through September 2019. It further compares these usage levels to MBA estimates of purchase and refinance origination volume for the respective quarters.
Warehouse usage levels represent total dollar volume of outstanding borrowings compared to total debt facility limit (in dollars offered) by the warehouse lender for first mortgage loans held for sale.
This September’s 65 percent usage level is the highest reported in our survey to date, corresponding with the highest quarterly refinancing and purchase volumes reported for the same period. In March, the turnaround in mortgage activity was already apparent in a higher warehouse usage level–44 percent–compared to 39 percent in December 2018. This was a precursor to higher refinancing and purchase originations volume in the following quarter.
(Marina Walsh is vice president of industry benchmarking and research with MBA; she can be reached at mwalsh@mba.org. Jonathan Penniman is assistant director of systems and analytics with MBA; he can be reached at jpenniman@mba.org.)