MBA last week released its Quarterly Performance Report for the first quarter. The total sample of 336 independent mortgage banks and mortgage subsidiaries of chartered banks earned an average pre-tax production profit of 61 basis points (or $1,600) on each loan they originated – a solid showing particularly for a first quarter.
Tag: MBA Chart of the Week
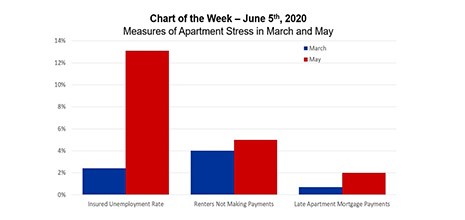
MBA Chart of the Week: Measures of Apartment Stress in March and May
There has been an important disconnect between the labor market and apartment markets over the last two months.
MBA Chart of the Week: Proportion of Work Being Performed Remotely
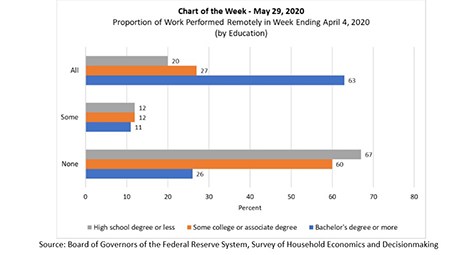
MBA’s Chart of the Week three weeks ago (May 8) focused on the U.S. Bureau of Labor Statistics’ bleak April report on employment conditions. We examined which industries and sectors have been hardest hit by the COVID-19 pandemic. This week, we continue our examination of the labor market using new survey data released by the Federal Reserve Board, and examine, by education level, how many people were able to work from home as the crisis deepened in early April.
MBA Chart of the Week: Proportion of Work Being Performed Remotely
MBA’s Chart of the Week three weeks ago (May 8) focused on the U.S. Bureau of Labor Statistics’ bleak April report on employment conditions. We examined which industries and sectors have been hardest hit by the COVID-19 pandemic. This week, we continue our examination of the labor market using new survey data released by the Federal Reserve Board, and examine, by education level, how many people were able to work from home as the crisis deepened in early April.
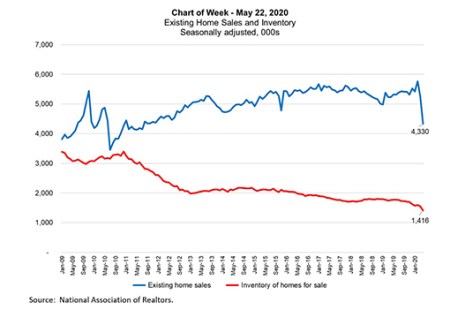
MBA Chart of the Week: Existing Home Sales and Inventory
Existing home sales plunged in April, as much of the U.S. economy and housing market bore the brunt of the COVID-19 pandemic’s social distancing and closures. There was an 18 percent drop in the seasonally adjusted, annualized pace of home sales, the largest single month decline since July 2010.
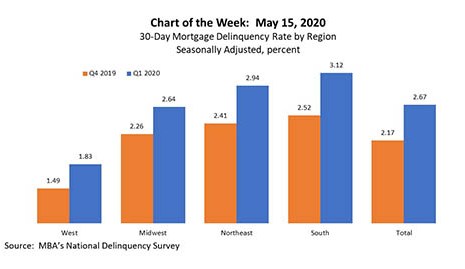
MBA Chart of the Week: 30-Day Mortgage Delinquency Rate by Region
MBA released its latest National Delinquency Survey for first quarter 2020 earlier this week. At the end of the first quarter, the delinquency rate for mortgage loans on one-to-four-unit residential properties jumped by 59 basis points to a seasonally adjusted rate of 4.36 percent of all loans outstanding.
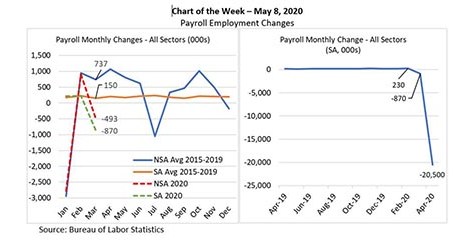
MBA Chart of the Week: Payroll Employment Changes
This week’s MBA Chart of the Week focuses on Friday’s grave employment report from the Bureau of Labor Statistics. The COVID-19 crisis has hit employment and household income in an unprecedented and accelerated fashion.
MBA Chart of the Week: Payroll Employment Changes
This week’s MBA Chart of the Week focuses on Friday’s grave employment report from the Bureau of Labor Statistics. The COVID-19 crisis has hit employment and household income in an unprecedented and accelerated fashion.
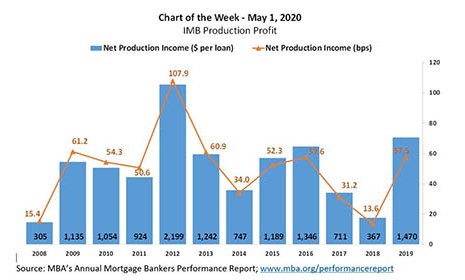
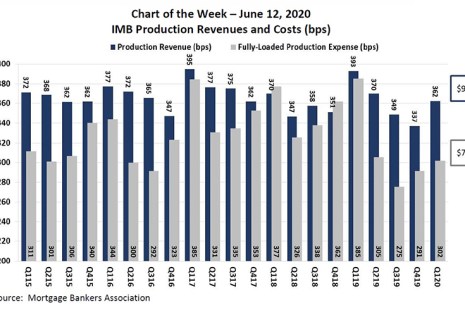
MBA Chart of the Week: IMB Production Profits
Independent mortgage banks and mortgage subsidiaries of chartered banks reported average pre-tax production profits of 58 basis points ($1,470 on each loan they originated) in 2019, up from 14 basis points ($367 per loan) in 2018, according to the MBA Annual Mortgage Bankers Performance Report, released last month.