MBA Chart of the Week: IMB Production Revenues & Costs
MBA last week released its Quarterly Performance Report for the first quarter. The total sample of 336 independent mortgage banks and mortgage subsidiaries of chartered banks earned an average pre-tax production profit of 61 basis points (or $1,600) on each loan they originated – a solid showing particularly for a first quarter.
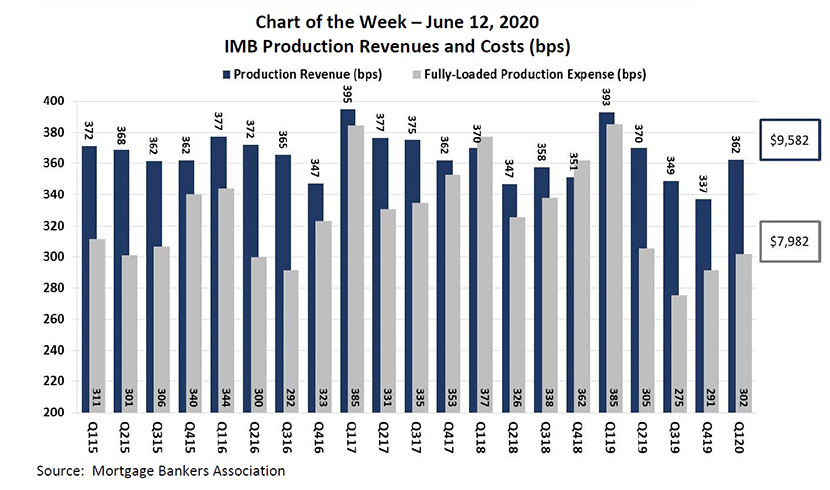
In this week’s chart, we show production revenues compared to production expenses from first quarter 2015 to first quarter 2020. Revenues grew by 25 basis points (bps) from the fourth quarter, offsetting a reported increase in expenses.
Total production revenue (fee income, net secondary marking income and warehouse spread) increased to 362 bps in the first quarter, up from 337 bps in fourth quarter 2019. On a per-loan basis, production revenues increased to $9,582 per loan in the first quarter, up from $8,707 per loan in the fourth quarter. Widening credit spreads boosted secondary marketing income and fee income also increased.
Total loan production expenses – commissions, compensation, occupancy, equipment, and other production expenses and corporate allocations – increased to 302 bps in the first three months of this year from 291 basis points in last year’s fourth quarter. On a per-loan basis, production expenses increased to $7,982 per loan in the first quarter, up from $7,525 per loan in the fourth quarter.
Despite the reported increase from the previous quarter, production expenses for a first quarter were at their lowest levels of this chart’s time period, and down 83 basis points on a year-over-year basis.
Marina Walsh mwalsh@mba.org; Jenny Masoud jmasoud@mba.org.