MBA Chart of the Week: Payroll Employment Changes
Source: Bureau of Labor Statistics.
This week’s MBA Chart of the Week focuses on Friday’s grave employment report from the Bureau of Labor Statistics. The COVID-19 crisis has hit employment and household income in an unprecedented and accelerated fashion.
To put the situation into context, the previous high for insured unemployment was 6.64 million individuals in May 2009 (during the Great Recession). Thursday’s unemployment insurance weekly claims report from the Department of Labor put the insured unemployed at 22.65 million—and due to lags in reporting, this number is expected to continue to grow in the coming weeks.
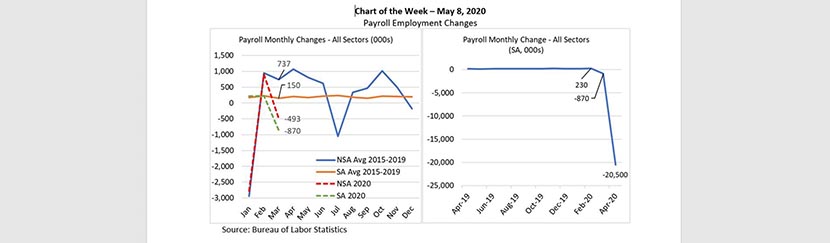
The BLS monthly employment update, released Friday, is based on two surveys. The household survey is used to estimate unemployment rates (that jumped to 14.7% from 4.4% in April), and the establishment survey of businesses and government agencies provides estimates of employment, hours and earnings of workers on nonfarm payrolls. Through February, nonfarm payroll employment had risen for 113 straight months. This ended in March with employment losses of 870,000 (revised from the preliminary losses of 701,000 published last month).
The left-hand panel shows seasonally adjusted and non-adjusted monthly changes in payrolls. The solid lines show the average monthly changes from 2015-2019, and the dashed lines show the monthly changes for January through March for this year. The non-seasonally adjusted average for 2015-19 (blue line) emphasizes how the pandemic’s effects are being acutely felt at the time of the year when employment usually ramps up. The employment losses reported for March are based on the number of people on payrolls during the pay period that included March 12th. This feels like ancient history, and as we can see in the right-hand panel, the March losses were the tip of the iceberg.
The current loss of 20.5 million for April eclipses all previous payroll changes. The drop in the private service-providing sector was 84% of the overall decline. In particular, leisure and hospitality employment dropped by 7.7 million, trade/transport/utilities by 3.06 million, education and health services by 2.54 million and professional and business services by 2.13 million. The April decline in employment in the goods-producing sector was 2.36 million, including a loss of 0.98 million in construction and 1.33 million in manufacturing. The Government sector was also hit, with a payroll loss of 0.98 million.
We are closely tracking the employment situation and how it directly affects homeowners, renters and commercial real estate tenants. The results of MBA’s latest weekly forbearance survey results will be released on Monday, May 11.
–Edward Seiler eseiler@mba.org.