This week’s MBA Chart of the Week drills down on the U.S. Bureau of Economic Analysis’ advance estimate of real gross domestic product for the second quarter, which was released July 30.
Tag: MBA Chart of the Week
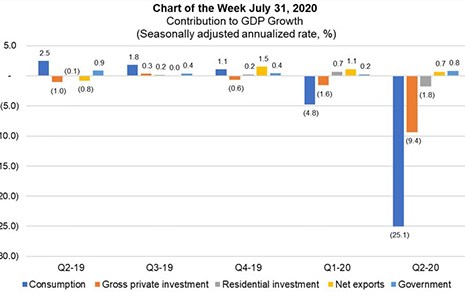
MBA Chart of the Week: Contribution to GDP Growth
This week’s MBA Chart of the Week drills down on the U.S. Bureau of Economic Analysis’ advance estimate of real gross domestic product for the second quarter, which was released July 30.
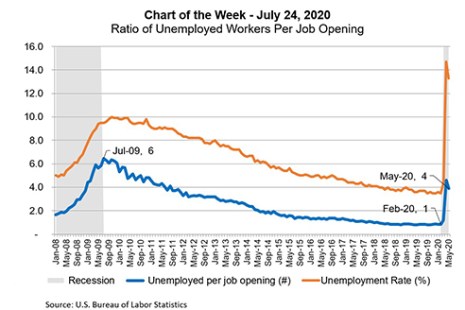
MBA Chart of the Week: Ratio of Unemployed Workers Per Job Opening
This week’s MBA Chart of the Week uses data from the U.S. Bureau of Labor Statistics to look at the ratio of the number of unemployed workers to job openings to highlight how the current recession is different than the recession in 2007-2009.
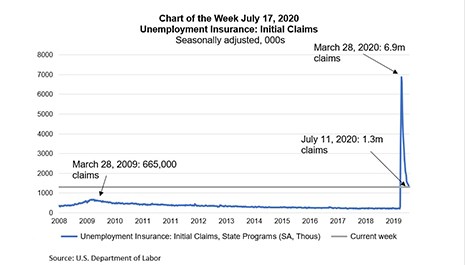
MBA Chart of the Week: Unemployment Insurance/Initial Claims
This week’s chart highlights initial unemployment claims data from the U.S. Department of Labor, portraying the speed and severity of the labor market’s deterioration during the COVID-19 pandemic, as businesses closed or transitioned to remote working arrangements.
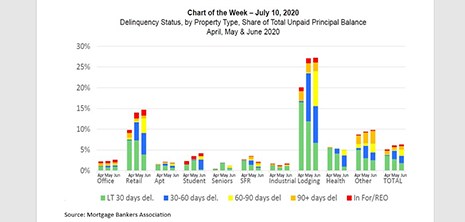
MBA Chart of the Week: Delinquency Status of Unpaid Principal Balance 2nd Quarter
The $3.7 trillion commercial and multifamily mortgage market is really a confederation of different capital sources, property types and geographic markets, all bound together by the provision of mortgage capital backed by investment property incomes and collateral value. Often, the overall market moves in tandem. At other times – like now – different segments act very differently.
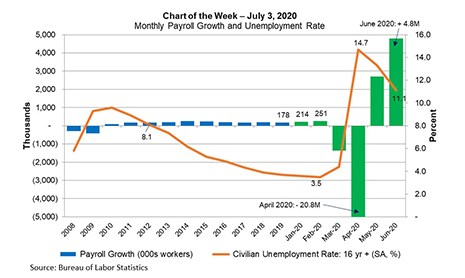
MBA Chart of the Week: Monthly Payroll Growth and Unemployment Rate
The economy added a record 4.8 million jobs to nonfarm payrolls in June, bringing the cumulative increase in May and June to one-third of the sharp decreases in March and April. Similarly, the June unemployment rate, at 11.1%, was down 3.6% from its high in April, and labor force participation jumped by 0.7% to 61.5% (1.9% below its pre-coronavirus level in February). However, we are not yet out of the woods.
