MBA Research released its annual CREF Bingo card, covering top topics we expect to hear discussed in sessions, hallway conversations and receptions.
Tag: MBA Chart of the Week
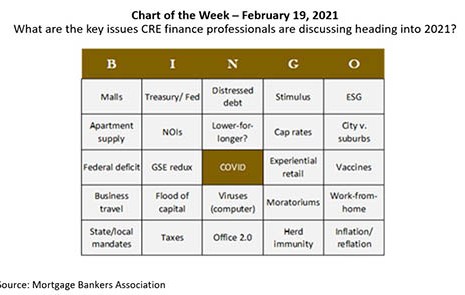
MBA Chart of the Week: CREF Bingo Card
MBA Research released its annual CREF Bingo card, covering top topics we expect to hear discussed in sessions, hallway conversations and receptions.
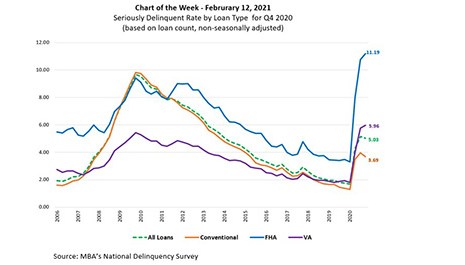
MBA Chart of the Week: NDS Seriously Delinquent Rate By Loan Type
MBA last week released its National Delinquency Survey results for the fourth quarter. The delinquency rate for mortgage loans on one-to-four-unit residential properties at the end of the quarter decreased from a seasonally adjusted rate of 7.65 percent of all loans outstanding in the third quarter to 6.73 percent in the fourth quarter. This 92-basis-point drop in the delinquency rate was the biggest quarterly decline in the history of MBA’s survey dating back to 1979.
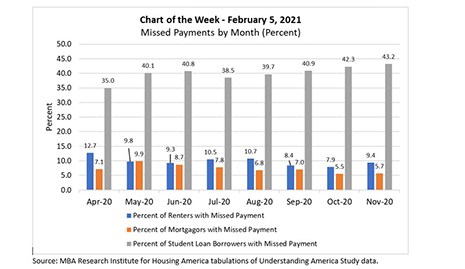
MBA Chart of the Week: Missed Payments By Month (Percent)
This week’s MBA Chart of the Week chart provides a preview of newly updated pandemic-related household financial insights that MBA’s Research Institute for Housing America released this morning, Feb. 8.
MBA Chart of the Week: Missed Payments By Month (Percent)
This week’s MBA Chart of the Week chart provides a preview of newly updated pandemic-related household financial insights that MBA’s Research Institute for Housing America released this morning, Feb. 8.
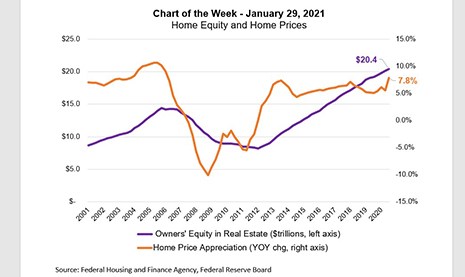
MBA Chart of the Week: Home Equity and Home Prices
Homeowners’ equity in housing was at a record high of $20.4 trillion in the third quarter. The steady upward trend since 2012 was spurred by accelerating home-price growth and low mortgage rates, which have helped many households build equity in their homes.
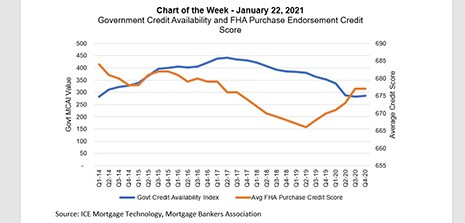
MBA Chart of the Week: Government Credit Availability & FHA Purchase Endorsement Credit Score
Lenders tightened mortgage credit in the first half of 2020, as the onset of the COVID-19 pandemic caused the economy to suffer its sharpest single-quarter contraction in history. Mortgage credit availability, as measured by our series of indexes, has recovered slightly in recent months. However, availability is still close to its tightest levels since 2014.