MBA Chart of the Week: Annual Price Gains
Our Thanksgiving-themed Chart of the Week highlights the strength in turkey price growth in 2020, along with year-over-year price changes for a few other goods categories.
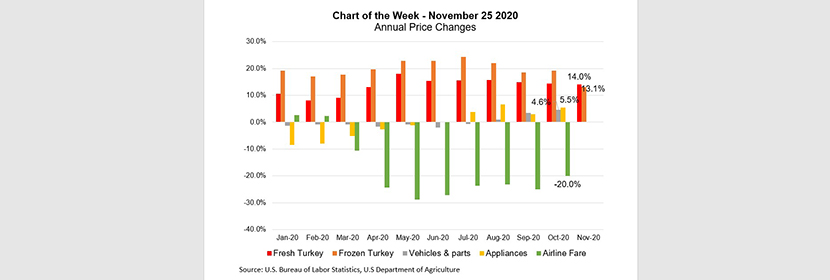
The data on turkey prices are from the U.S. Department of Agriculture in cents per pound, and are broken out into categories for fresh and frozen turkeys. As of the first half of November, fresh turkey prices were 14 percent higher compared to the same period a year ago, while frozen turkeys were 13 percent more expensive – very robust price growth considering the overall Consumer Price Index gain was 1.2 percent in October.
In light of changes in consumer behavior brought about by the pandemic, more people spend an increased amount of time at home and travel less, which has led to additional spending on goods needed around the home. Appliance prices showed a 5.5 percent increase in October, compared to negative price growth in the first three months of the year, prior to the pandemic.
Motor vehicle prices have also been pushed higher, as many people upgrade their own vehicles to avoid air travel. Motor vehicle prices increased 4.6 percent in October, after very benign price growth earlier in the year. Conversely, airfares dropped more than 21 percent in October, and separate data on TSA checkpoint throughput still show very depressed levels of flyer traffic.
Joel Kan jkan@mba.org.