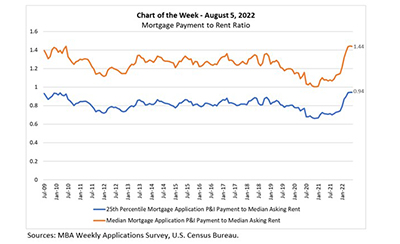
This MBA Chart of the Week examines the relationship between mortgage payments and asking rents since the second half of 2009. MBA’s national mortgage payment to rent ratio compares the national median and 25th percentile mortgage payments to the national median asking rent.
Tag: MBA Chart of the Week
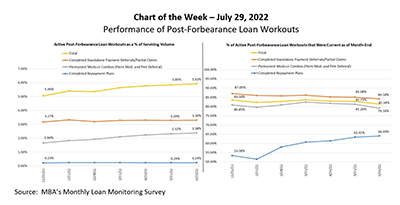
MBA Chart of the Week July 29, 2022: Performance of Post-Forbearance Loan Workouts
According to MBA’s Monthly Loan Monitoring Survey, the share of loans in forbearance dropped slightly to 0.81 percent of servicers’ portfolio volume as of June 30, 2022, from 0.85 percent the prior month.
MBA Chart of the Week July 29, 2022: Performance of Post-Forbearance Loan Workouts
According to MBA’s Monthly Loan Monitoring Survey, the share of loans in forbearance dropped slightly to 0.81 percent of servicers’ portfolio volume as of June 30, 2022, from 0.85 percent the prior month.
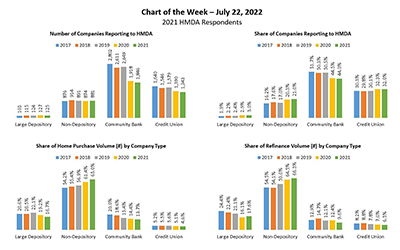
MBA Chart of the Week: 2021 HMDA Respondents
A total of 4,195 companies reported lending activity under the Home Mortgage Disclosure Act in 2021, according to MBA’s own analyses of the dataset. Company types are defined by primary regulator and balance sheet assets, with large depositories holding assets of $10 billion or more.
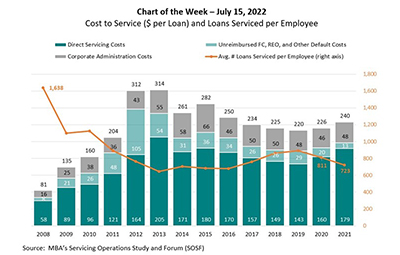
MBA Chart of the Week July 15 2022: Cost to Service Loans Per Employee
MBA’s annual Servicing Operations Study and Forum includes a deep-dive analysis and discussion of servicing costs, productivity, portfolio activity and operational metrics for in‐house servicers. This week’s MBA Chart of the Week shows 2021 fully loaded servicing costs, which include three components: direct expenses; unreimbursed foreclosure, REO and other default costs; and corporate administration costs.
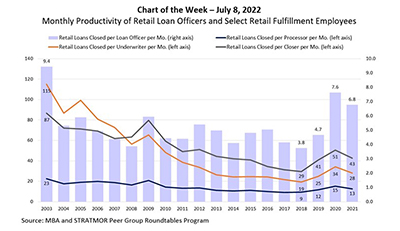
MBA Chart of the Week July 8, 2002: Retail Loan Officer Productivity
In this week’s Chart of the Week, we turn to data from the longstanding MBA and STRATMOR Peer Group Roundtables Program), which recently wrapped up its Spring season for benchmarking lender performance across various production channels and peer groups.
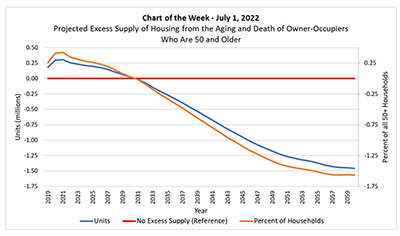
MBA Chart of the Week July 1, 2022: Projected Excess Supply of Housing from the Aging of Baby Boomers
The Research Institute for Housing America, MBA’s think tank, released a special report, “Who Will Buy the Baby Boomers’ Homes When They Leave Them?”, authored by Gary Engelhardt of Syracuse University. The report examines population aging, mortality and the future of the housing market.