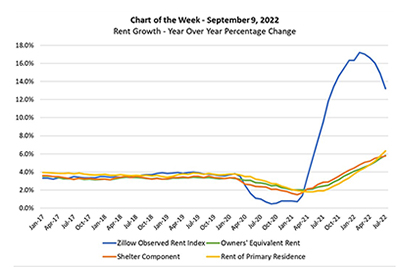
This week’s MBA Chart of the Week highlights a question related to housing costs and inflation: If home price appreciation and rent growth have been in double digits in the past few quarters—as highlighted by the (blue lined) Zillow Observed Rent Index in the chart—why is the shelter component (orange line) of the Consumer Price Index below 6%?
Tag: MBA Chart of the Week
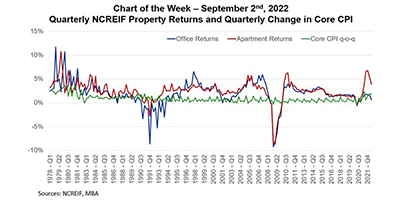
MBA Chart of the Week: Quarterly NCREIF Property Returns
The forward path of inflation remains a topic of great debate and conjecture. How that path plays into the relative benefits of different investment options – including commercial real estate and other real assets – will give us even more insights into the relationship.
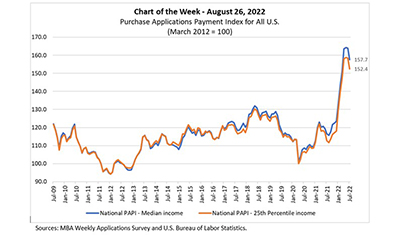
MBA Chart of the Week, Aug. 26, 2022: MBA Purchase Applications Payment Index
In this MBA Chart of the Week, we examine how market transitions are affecting homebuyer affordability.
MBA Chart of the Week, Aug. 26, 2022: MBA Purchase Applications Payment Index
In this MBA Chart of the Week, we examine how market transitions are affecting homebuyer affordability.
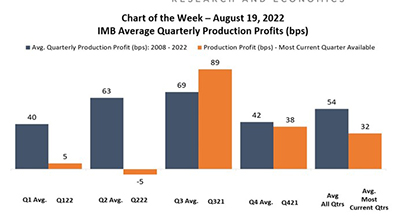
MBA Chart of the Week Aug. 19 2022: IMB Average Quarterly Production Profits
This week’s MBA Chart of the Week illustrates the average historical pre-tax production profits for each respective quarter of the year, from Q3 2008 to Q2 2022. These historical quarterly averages are then compared to the most current net production profit corresponding to that quarter.
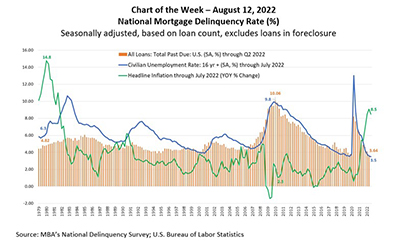
MBA Chart of the Week, Aug. 12, 2022: National Mortgage Delinquency Rate
This week’s MBA Chart of the Week highlights the relationship between MBA’s mortgage delinquency rate and two economic indicators, the unemployment rate, and year-over-year changes in headline inflation – measuring the price of goods and services in the economy.