MBA Chart of the Week July 8, 2002: Retail Loan Officer Productivity
Based on the most recent MBA forecast, mortgage originations are expected to drop to $2.4 trillion (or 6.7 million loans) in 2022 from $4.0 trillion (or 11.3 million loans) in 2021. This rapid shift in industry volume, after two years of record-setting levels not seen since 2003, has forced mortgage companies to manage to the business cycle and adjust capacity accordingly.
In these new market conditions, an important question to ask is what are the realistic benchmarks for sales and fulfillment employee productivity?
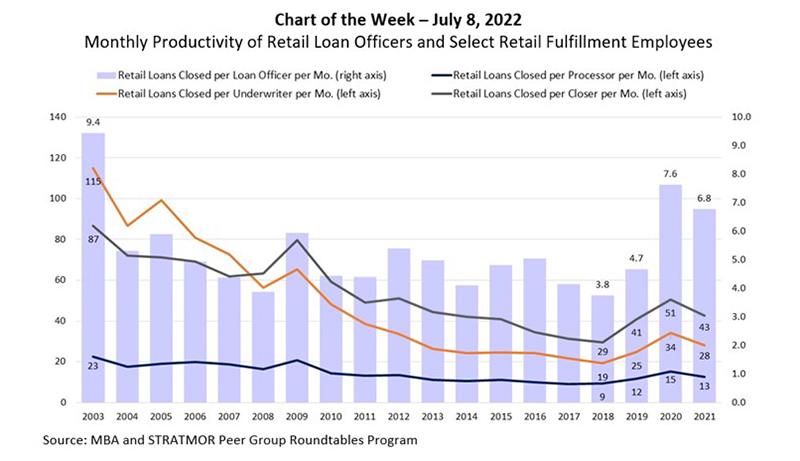
In this week’s Chart of the Week, we turn to data from the longstanding MBA and STRATMOR Peer Group Roundtables Program), which recently wrapped up its Spring season for benchmarking lender performance across various production channels and peer groups. From 2003-2021, we aggregated data from large banks, credit unions and community banks, as well as large and mid-size independent mortgage banks, to produce a full PGR sample of companies reporting in the Retail production channel – approximately 90 companies in 2021. The Retail channel is characterized by loans originated through loan officers (who are employees of your company) within standard or bank branch network systems. Direct face-to-face or local contact with the mortgagor (instead of a centralized call center) is characteristic of this channel.
Unsurprisingly, the three best years in terms of monthly loan officer productivity were 2003, 2020 and 2021 – coinciding with the three best years for overall industry volume. But that was not the case for key fulfillment functions – processors, underwriters and closers. For example, Retail loans closed per underwriter per month dropped from 115 in 2003 to 28 in 2021 – more than four-times times lower. Similarly, Retail loans closed per closer per month dropped from 87 in 2003 to 43 in 2021. The decline in productivity during this period for loan processors was less pronounced though still significant with 13 Retail loans closed per processor in 2021, compared to 23 in 2003.
Possible factors (other than volume) influencing the decline in fulfillment productivity include regulations and compliance, changing investor requirements and overlays, repurchase fears, staffing difficulties and high turnover, appraisal challenges and the shift in servicing portfolio retention loans and streamline refinancings to the Consumer Direct channel from the Retail channel.
Given the results from this time series, more recent productivity benchmarks from the 2017-2019 timeframe may be the most meaningful gages of fulfillment productivity in the post-refi boom era.
- Marina Walsh, CMB (mwalsh@mba.org)