MBA Chart of the Week July 15 2022: Cost to Service Loans Per Employee
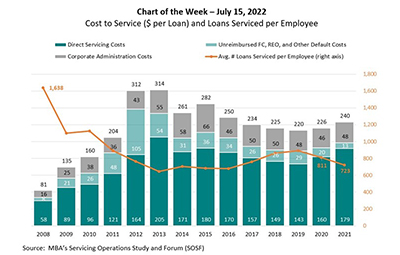
MBA’s annual Servicing Operations Study and Forum includes a deep-dive analysis and discussion of servicing costs, productivity, portfolio activity and operational metrics for in‐house servicers. This week’s MBA Chart of the Week shows 2021 fully loaded servicing costs, which include three components: direct expenses; unreimbursed foreclosure, REO and other default costs; and corporate administration costs. The chart also presents the number of loans serviced per servicing employee.

Fully loaded servicing costs during 2008 through 2021 increased three-fold and have not dropped below $200 per loan since the passage of the Dodd-Frank Act in 2010. Moreover, productivity has not exceeded 1,000 loans per employee since 2010. After a period of incremental improvements from 2016-2019, servicing costs started to rise and reached $240 per loan in 2021, up from $226 per loan in 2020. Direct cost increases – which grew by $19 per loan in 2021 – were apparent in such functional areas as collections, loss mitigation, foreclosure, call center, payoffs, escrow and systems.
Despite the relatively benign default environment that tracked closely to low unemployment levels, activity associated with post-forbearance workouts picked up in 2021. In addition, the federal foreclosure moratorium was lifted in July 2021, bringing more work to servicers’ default departments to ensure investor and regulatory compliance.
As competition for human capital grew, employee turnover reached a study-high 29% last year, despite higher overall compensation per employee. This contributed not only to increased costs but also decreased productivity, which dropped to 723 loans serviced per servicing employee in 2021 from 811 in 2020.
Marina Walsh, CMB mwalsh@mba.org.