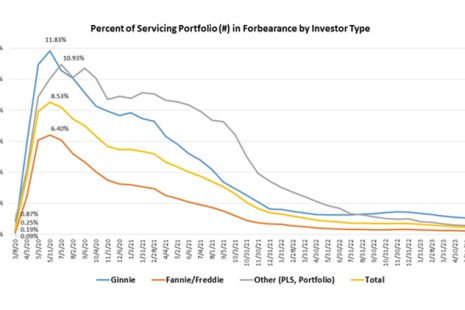
The Mortgage Bankers Association’s monthly Loan Monitoring Survey revealed the total number of loans now in forbearance decreased by 5 basis points to 0.44% of servicers’ portfolio volume as of June 30, 2023.
Tag: Marina Walsh CMB
MBA: Share of Mortgage Loans in Forbearance Decreases to 0.44% in June
The Mortgage Bankers Association’s monthly Loan Monitoring Survey revealed the total number of loans now in forbearance decreased by 5 basis points to 0.44% of servicers’ portfolio volume as of June 30, 2023.
MBA: Share of Mortgage Loans in Forbearance Drops to 0.49% in May
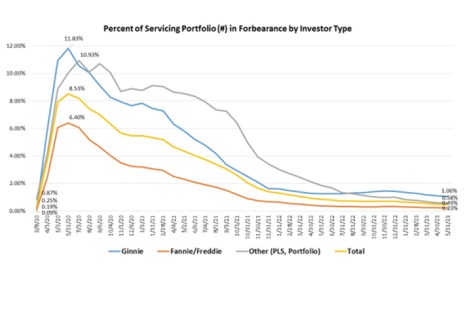
The total number of loans now in forbearance decreased to 0.49% for May from 0.51% of servicers’ portfolio volume in April, the Mortgage Bankers Association’s monthly Loan Monitoring Survey reported.
MBA: Share of Mortgage Loans in Forbearance Drops to 0.49% in May
The total number of loans now in forbearance decreased to 0.49% for May from 0.51% of servicers’ portfolio volume in April, the Mortgage Bankers Association’s monthly Loan Monitoring Survey reported.
MBA: Share of Mortgage Loans in Forbearance Drops to 0.49% in May
The total number of loans now in forbearance decreased to 0.49% for May from 0.51% of servicers’ portfolio volume in April, the Mortgage Bankers Association’s monthly Loan Monitoring Survey reported.
MBA: IMBs Report Pre-Tax Net Production Losses in 1Q
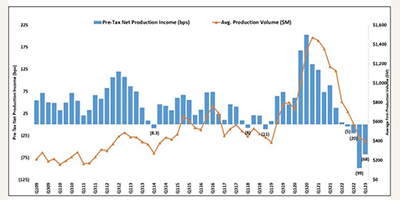
Independent mortgage banks and mortgage subsidiaries of chartered banks reported a net loss of $1,972 on each loan they originated in the first quarter, an improvement from the reported loss of $2,812 per loan in the fourth quarter, the Mortgage Bankers Association reported Thursday.
MBA: IMBs Report Pre-Tax Net Production Losses in 1Q
Independent mortgage banks and mortgage subsidiaries of chartered banks reported a net loss of $1,972 on each loan they originated in the first quarter, an improvement from the reported loss of $2,812 per loan in the fourth quarter, the Mortgage Bankers Association reported Thursday.
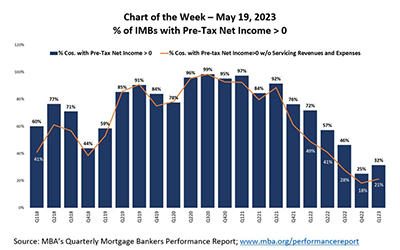
MBA Chart of the Week May 19, 2023: % of IMBs with Pre-Tax Net Income
Today’s Chart of the Week compares the percentage of companies in the QPR that reported positive pre-tax net income including all lines of business (e.g. production and servicing operations), versus the percentage of companies that reported positive pre-tax net income, once servicing operations are excluded.
MBA: IMBs Report Pre-Tax Net Production Losses in 1Q
Independent mortgage banks and mortgage subsidiaries of chartered banks reported a net loss of $1,972 on each loan they originated in the first quarter, an improvement from the reported loss of $2,812 per loan in the fourth quarter, the Mortgage Bankers Association reported Thursday.