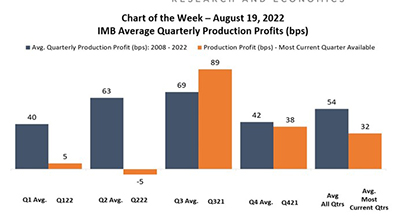
This week’s MBA Chart of the Week illustrates the average historical pre-tax production profits for each respective quarter of the year, from Q3 2008 to Q2 2022. These historical quarterly averages are then compared to the most current net production profit corresponding to that quarter.
Tag: Jenny Masoud
MBA Chart of the Week May 27, 2022: IMB Production Revenues and Costs
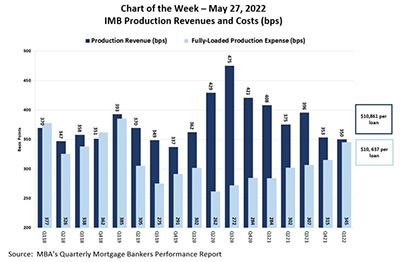
MBA last week released its latest Quarterly Performance Report for the first quarter. In this week’s Chart of the Week, we show production revenues compared to production expenses from first quarter 2018 to first quarter 2022.
MBA Chart of the Week May 27, 2022: IMB Production Revenues and Costs
MBA last week released its latest Quarterly Performance Report for the first quarter. In this week’s Chart of the Week, we show production revenues compared to production expenses from first quarter 2018 to first quarter 2022.
MBA Chart of the Week Apr. 22 2022: IMB Production
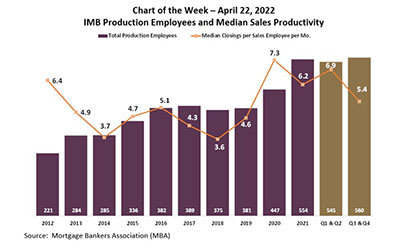
This week’s chart shows average production employees (sales, fulfillment and support staff for such functions as production technology, post-closing and secondary marketing) and median productivity of sales staff from 2012 through 2021.
MBA Chart of the Week Apr. 22 2022: IMB Production
This week’s chart shows average production employees (sales, fulfillment and support staff for such functions as production technology, post-closing and secondary marketing) and median productivity of sales staff from 2012 through 2021.

#MBATech2022: How Trends Intersect in a Changing Industry
LAS VEGAS—Real estate finance has migrated quickly from a person-to-person business to a person-to-tech-device-to-person business. And socio-economic forces are rapidly steering technology to reshape business—even as business continues to fine-tune technology.
MBA Chart of the Week Mar. 25 2022: IMB Net Production Income/Average Production Volume
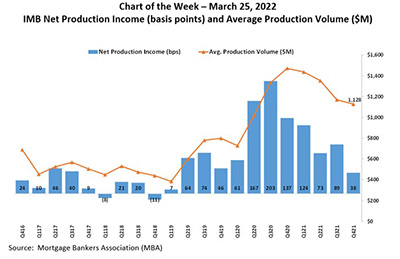
In this week’s MBA Chart of the Week, we show the average net production income from fourth-quarter 2016 through fourth-quarter 2021, along with the average production volume per company.
MBA Chart of the Week Mar. 25 2022: IMB Net Production Income/Average Production Volume
In this week’s MBA Chart of the Week, we show the average net production income from fourth-quarter 2016 through fourth-quarter 2021, along with the average production volume per company.
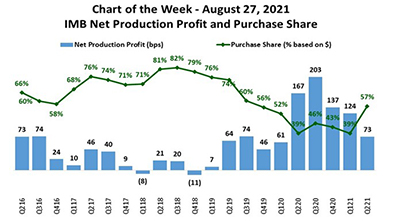
MBA Chart of the Week Aug. 30 2021: IMB Net Production Profit & Purchase Share
In this week’s MBA Chart of the Week, we look at net production profit in basis points, relative to the purchase share of total first mortgage originations by dollar volume over a five-year time span – second quarter 2016 through second quarter 2021.