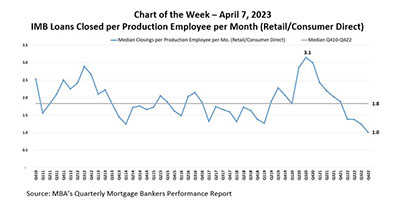
In this week’s MBA Chart of the Week, we look at the median productivity of production employees for these independent mortgage bankers, given this drop in production volume.
Tag: Jenny Masoud
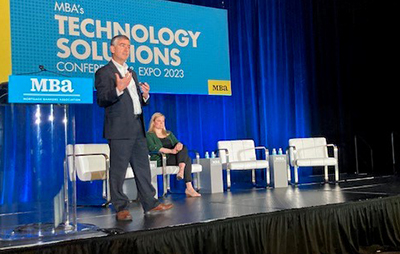
#MBATech23: Challenging Economic Conditions Persist
SAN JOSE, Calif.—After several years of extraordinary—and unexpected—mortgage performance despite the coronavirus pandemic, 2023 is a decidedly different—and less desirable—business environment, said MBA economists.
MBA Chart of the Week Mar. 17, 2023: IMB Net Profits, Production Volume
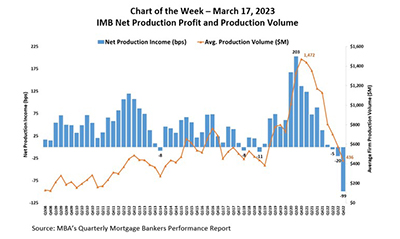
In this MBA Chart of the Week, we look at production profits in basis points, relative to average production volume, from inception of the MBA Quarterly Mortgage Bankers Performance Report series in third quarter 2008 through fourth quarter 2022.
MBA Chart of the Week Mar. 17, 2023: IMB Net Profits, Production Volume
In this MBA Chart of the Week, we look at production profits in basis points, relative to average production volume, from inception of the MBA Quarterly Mortgage Bankers Performance Report series in third quarter 2008 through fourth quarter 2022.

Cheryl Lieber and Katie Caggiano of the MBA HR Professionals Networking Group
The Mortgage Bankers Association’s Human Resources Professionals Networking Group is an MBA member networking opportunity for HR heads, directors and managers of mortgage banking institutions or their designates.

Cheryl Lieber and Katie Caggiano of the MBA HR Professionals Networking Group
The Mortgage Bankers Association’s Human Resources Professionals Networking Group is an MBA member networking opportunity for HR heads, directors and managers of mortgage banking institutions or their designates.
Cheryl Lieber and Katie Caggiano of the MBA HR Professionals Networking Group
The Mortgage Bankers Association’s Human Resources Professionals Networking Group is an MBA member networking opportunity for HR heads, directors and managers of mortgage banking institutions or their designates.
Cheryl Lieber and Katie Caggiano of the MBA HR Professionals Networking Group
The Mortgage Bankers Association’s Human Resources Professionals Networking Group is an MBA member networking opportunity for HR heads, directors and managers of mortgage banking institutions or their designates.
Cheryl Lieber and Katie Caggiano of the MBA HR Professionals Networking Group
The Mortgage Bankers Association’s Human Resources Professionals Networking Group is an MBA member networking opportunity for HR heads, directors and managers of mortgage banking institutions or their designates.
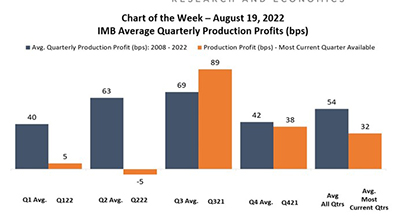
MBA Chart of the Week Aug. 19 2022: IMB Average Quarterly Production Profits
This week’s MBA Chart of the Week illustrates the average historical pre-tax production profits for each respective quarter of the year, from Q3 2008 to Q2 2022. These historical quarterly averages are then compared to the most current net production profit corresponding to that quarter.