The beginning of the year brings changes to employee benefits and associated costs for both mortgage company employers and employees.
Tag: Jenny Masoud
Chart of the Week IMB Net Production Income, Results for Top 20% and Bottom 20% of QPR Sample
For this Chart of the Week, we compare those companies in the top 20 percent for net production income in basis points versus those companies in the bottom 20 percent over the past ten years.
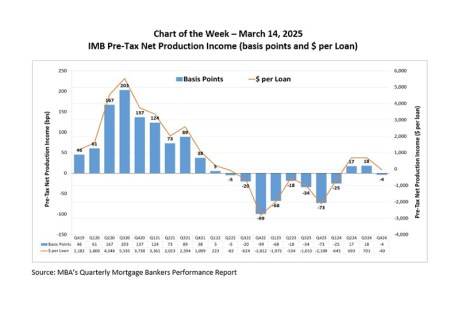
Chart of the Week: IMB Pre-Tax Net Production Income
Independent mortgage banks and mortgage subsidiaries of chartered banks reported a pre-tax net loss of 4 basis points in the fourth quarter, a decrease from the net profit of 18 basis points in the third quarter, MBA’s Quarterly Mortgage Bankers Performance Report found.

MBA Chart of the Week: 2023 Percent of Time Working Remotely for Processors, Underwriters and Closers (Retail Channel)
In this week’s Chart of the Week, we look at the percentage of time employees in key Retail fulfillment positions worked remotely in 2023 (excluding overtime) across different peer groups.
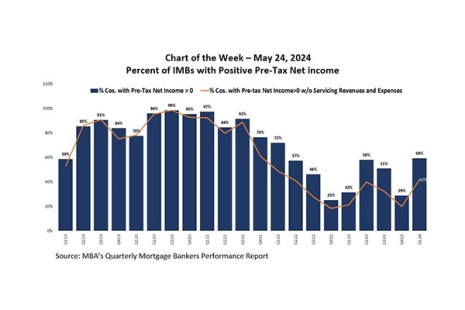
MBA Chart of the Week: Percent of IMBs With Positive Pre-Tax Net Income
According to MBA’s Q1 2024 Quarterly Mortgage Bankers Performance Report, independent mortgage banks and mortgage subsidiaries of chartered banks reported a pre-tax net production loss of 25 basis points, or $645 per loan.
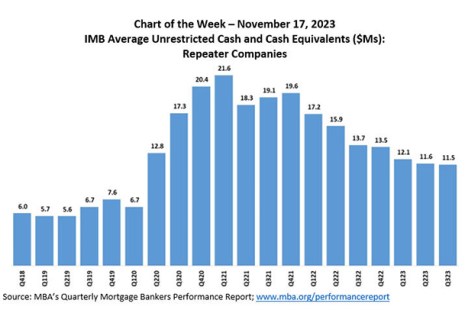
MBA Chart of the Week: IMB Average Unrestricted Cash & Cash Equivalents
MBA Research recently released the third quarter results of its Quarterly Mortgage Bankers Performance Report. The results showed that independent mortgage banks and bank subsidiaries reported a pre-tax net loss of $1,015 on each loan they originated in the third quarter of 2023, an increase from the reported loss of $534 per loan in the second quarter of 2023.
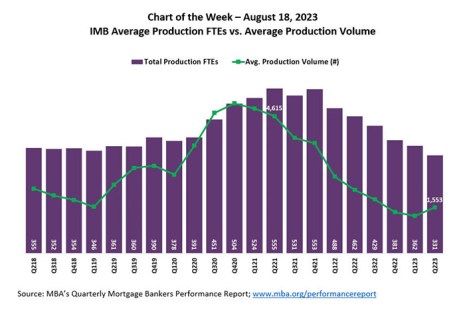
MBA Chart of the Week Aug. 22: Production Personnel and Production Volume
This MBA Chart of the Week compares production personnel to average quarterly production volume in count over the last five years.
MBA Chart of the Week Aug. 21: Production Personnel and Production Volume
This MBA Chart of the Week compares production personnel to average quarterly production volume in count over the last five years.
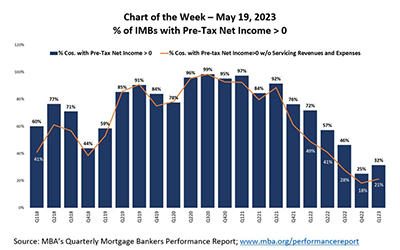
MBA Chart of the Week May 19, 2023: % of IMBs with Pre-Tax Net Income
Today’s Chart of the Week compares the percentage of companies in the QPR that reported positive pre-tax net income including all lines of business (e.g. production and servicing operations), versus the percentage of companies that reported positive pre-tax net income, once servicing operations are excluded.
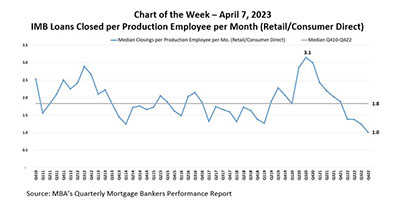
MBA Chart of Week Apr. 7, 2023: IMB Loans Closed Per Production Employee Per Month
In this week’s MBA Chart of the Week, we look at the median productivity of production employees for these independent mortgage bankers, given this drop in production volume.