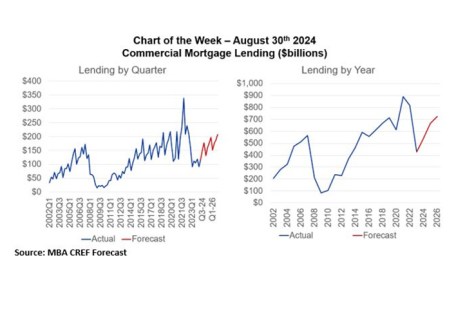
Is the logjam in CRE transaction activity starting to break?
Tag: Chart of the Week

MBA Chart of the Week: Pre-Tax Net Production Income and Production Volume
Independent mortgage banks and mortgage subsidiaries of chartered banks reported a pre-tax net profit of 17 basis points, or $693 on each loan they originated in the second quarter. according to MBA’s Quarterly Mortgage Bankers Performance Report.

MBA Chart of the Week: Early-Stage vs. Seriously Delinquent Mortgage Rates
According to the latest results from MBA’s National Delinquency Survey (NDS) released last week, the overall delinquency rate for mortgage loans on one‐to‐four‐unit residential properties increased to a seasonally adjusted rate of 3.97% of all loans outstanding at the end of the second quarter of 2024.
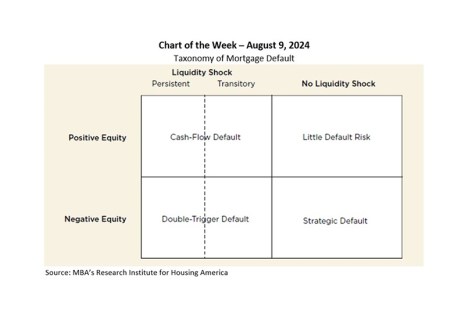
MBA Chart of the Week: Taxonomy of Mortgage Default
The Research Institute for Housing America recently released a special report that looked at the lessons learned from the Great Financial Crisis, the COVID-19 pandemic, and other past episodes of default, to understand how to design a more robust mortgage system that proactively supports sustainable homeownership.

MBA Chart of the Week: Monthly Payroll Growth and Unemployment Rate
The job market definitively slowed in July. Nonfarm payroll growth at 114,000 was well below the 12-month average of 215,000, while the unemployment rate moved up to its highest level since October 2021 at 4.3%, as shown in this week’s chart.

MBA Chart of the Week: 2023 Percent of Time Working Remotely for Processors, Underwriters and Closers (Retail Channel)
In this week’s Chart of the Week, we look at the percentage of time employees in key Retail fulfillment positions worked remotely in 2023 (excluding overtime) across different peer groups.
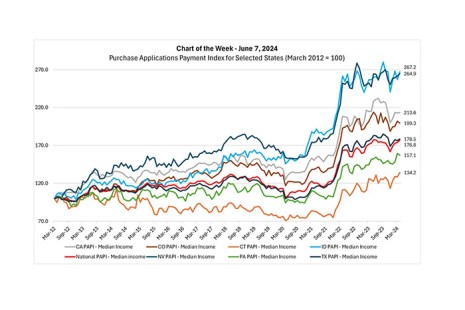
MBA Chart of the Week: Purchase Applications Payment Index for Selected States
Following the precipitous rise in interest rates and home prices in 2022 that starkly eroded affordability conditions for home buyers, the monthly cost burden of purchasing a new home continued to increase in 2023 and the first four months of 2024, albeit at a slower pace.

MBA Chart of the Week: 30-Year Fixed Mortgage Rate and 10-Year Treasury Yield
This week’s MBA Chart of the Week examines the spread between the 30-year fixed mortgage rate and 10-year Treasury yield.
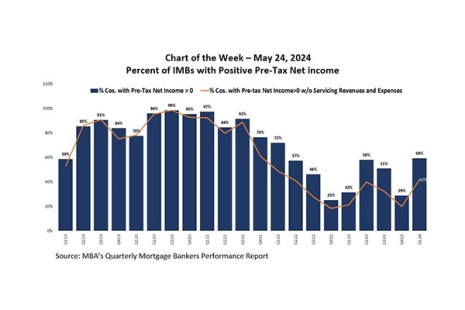
MBA Chart of the Week: Percent of IMBs With Positive Pre-Tax Net Income
According to MBA’s Q1 2024 Quarterly Mortgage Bankers Performance Report, independent mortgage banks and mortgage subsidiaries of chartered banks reported a pre-tax net production loss of 25 basis points, or $645 per loan.
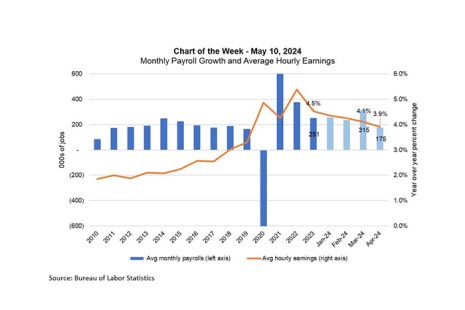
MBA Chart of the Week: Monthly Payroll Growth, Average Hourly Earnings
The Federal Open Market Committee (FOMC) left the federal funds target unchanged at its May meeting, as incoming data regarding the strength of the economy and stubbornly high inflation have resulted in a shift in the expected timing of a first rate cut.