At last month’s MBA Annual Convention and Expo in Las Vegas, lenders discussed and debated ways to reduce origination costs and increase productivity by investing in more modern technology, refining the use of technology, and making the loan production process more efficient. Improved servicing recapture and offering a greater variety of non-agency loan products were also explored as ways to achieve scale and spread fixed costs over more origination volume.
Tag: Chart of the Week

Chart of the Week: Purchase-Only House Price by Census Division
Home price growth in many markets around the U.S. is slowing. Based on July 2025 data from the Federal Housing Finance Agency’s House Price Indexes, year-over-year home price growth in the U.S. was 2.3% relative to July 2024.
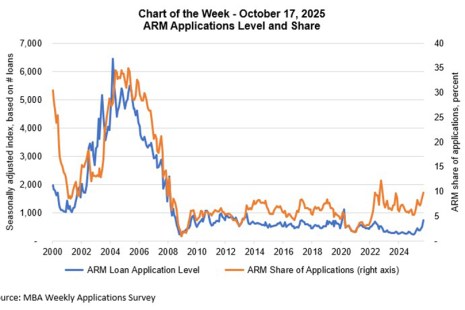
Chart of the Week: ARM Applications Level and Share
Adjustable-rate mortgages (ARMs), when used appropriately, can help ease affordability challenges and provide homeownership and equity building opportunities for qualified borrowers.
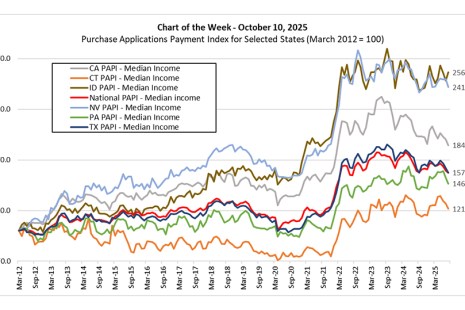
Chart of the Week: Purchase Applications Payment Index for Selected States
In this week’s Chart of the Week, we show the PAPI series – constructed using median Weekly Applications Survey (WAS) payments and median income – for the nation and six selected states.

Chart of the Week: Multifamily Market Share by Capital Source
This Chart of the Week focuses on the distribution of the multifamily market share by capital source. The multifamily market is a fundamental part of the broader commercial real estate market, and originations have been strong throughout 2025. The figure reports MBA estimates of the shares of originations by each capital source, overlaid with total multifamily origination volumes.
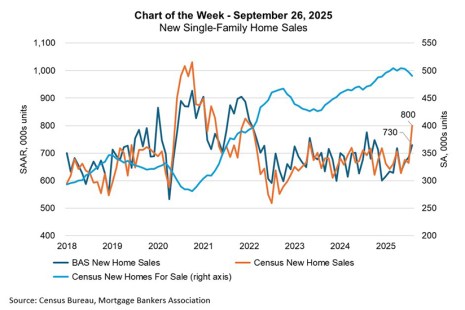
Chart of the Week: New Single-Family Home Sales
MBA’s estimate of new home sales, based on a larger sample than the one used by the Census Bureau, suggests that the increase in new home sales was smaller in August than Census calculated.

Chart of the Week: FOMC Summary of Economic Projections for Fed Funds Rate
Each quarter, the Federal Open Market Committee submit their projections for various economic measures. This month’s projections, shown in the Summary of Economic Projections, include 2028 for the first time.

Chart of the Week: IMB Net Production Income and Percent of IMBs With Pre-Tax Net Income > Zero
Independent mortgage banks and mortgage subsidiaries of chartered banks reported pre-tax net production profit of 25 bps ($950 per loan) on each loan they originated in the second quarter.
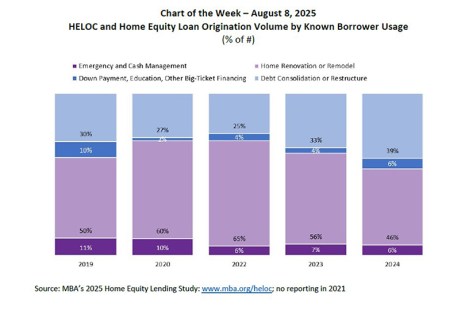
Chart of the Week: HELOC and Home Equity Loan Origination Volume by Known Borrower Usage
MBA recently completed its 2025 Home Equity Lending Study, tracking trends in origination and servicing for home equity lines of credit (HELOCs) and home equity loans.

Chart of the Week: 2024 HMDA Respondents
A total of 4,758 companies reported lending activity under the Home Mortgage Disclosure Act in 2024, according to MBA’s analyses of the dataset.