This week’s MBA Chart of the Week uses data from the U.S. Bureau of Labor Statistics to look at the ratio of the number of unemployed workers to job openings to highlight how the current recession is different than the recession in 2007-2009.
Tag: Bureau of Labor Statistics
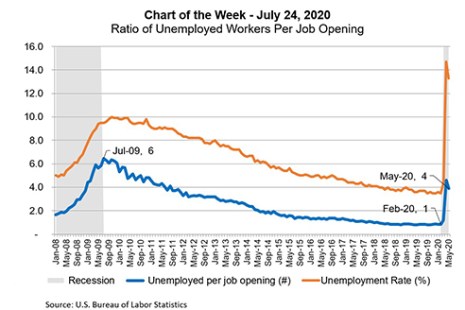
MBA Chart of the Week: Ratio of Unemployed Workers Per Job Opening
This week’s MBA Chart of the Week uses data from the U.S. Bureau of Labor Statistics to look at the ratio of the number of unemployed workers to job openings to highlight how the current recession is different than the recession in 2007-2009.
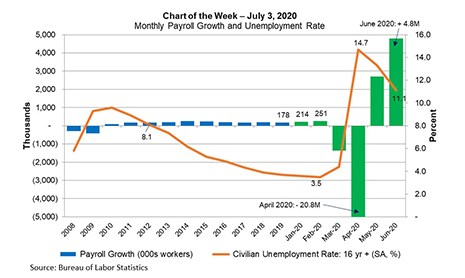
MBA Chart of the Week: Monthly Payroll Growth and Unemployment Rate
The economy added a record 4.8 million jobs to nonfarm payrolls in June, bringing the cumulative increase in May and June to one-third of the sharp decreases in March and April. Similarly, the June unemployment rate, at 11.1%, was down 3.6% from its high in April, and labor force participation jumped by 0.7% to 61.5% (1.9% below its pre-coronavirus level in February). However, we are not yet out of the woods.
June Jobs Up Nearly 5 Million; Unemployment Rate Drops; New Claims at 1.4 Million
The Bureau of Labor Statistics reported total nonfarm payroll employment jumped by 4.8 million in June, as easing of coronavirus restrictions brought back more workers who had been laid off earlier this spring.
An Upbeat Jobs Report, Followed by a ‘Misclassification Error’
At 8:30 a.m. on Friday, the Bureau of Labor Statistics issued a surprising May unemployment report: instead of the 8 million job losses expected by economists’ consensus, the report showed a dramatic 2.5 million increase in jobs, and a 1.4 percent dip in the unemployment rate, from 14.7 percent in April to 13.3 percent. But there was a catch–a huge catch.
ADP: May Private-Sector Employment Down 2.76 Million
In the first of three snapshots of employment data this week, ADP, Roseland, N.J., said private-sector employment fell by 2.76 million jobs in May.
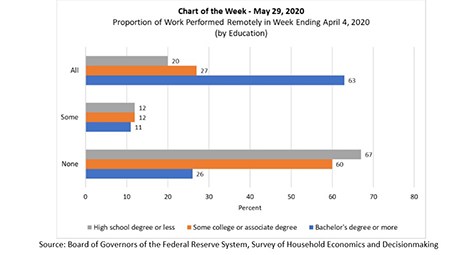
MBA Chart of the Week: Proportion of Work Being Performed Remotely
MBA’s Chart of the Week three weeks ago (May 8) focused on the U.S. Bureau of Labor Statistics’ bleak April report on employment conditions. We examined which industries and sectors have been hardest hit by the COVID-19 pandemic. This week, we continue our examination of the labor market using new survey data released by the Federal Reserve Board, and examine, by education level, how many people were able to work from home as the crisis deepened in early April.

A ‘Truly Unprecedented’ Time for Economy, Mortgage Industry
WASHINGTON, D.C.–The current economic situation is ‘unprecedented,’ said MBA Chief Economist Mike Fratantoni during the MBA Live: State of the Industry virtual conference on Tuesday.