Home Prices Finish Year at Highest Rate of Increase in 34 Years
The S&P CoreLogic Case-Shiller Home Price Indexes finished 2021 with the single-highest rate of increase in 34 years of data-keeping. In a separate report, the Federal Housing Finance Agency said 2021 home prices rose by 17.5 percent.
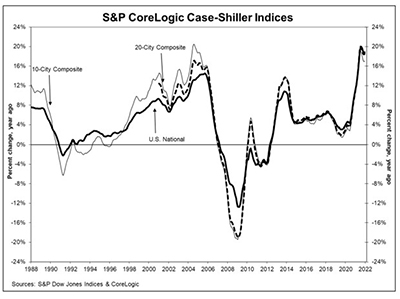
S&P CoreLogic Case-Shiller U.S. National Home Price NSA Index reported an 18.8% annual gain in December, unchanged from November. The 10-City Composite Index posted an annual increase of 17.0%, up from 16.9% in November. The 20-City Composite posted an 18.6% year-over-year gain, up from 18.3% the previous month.
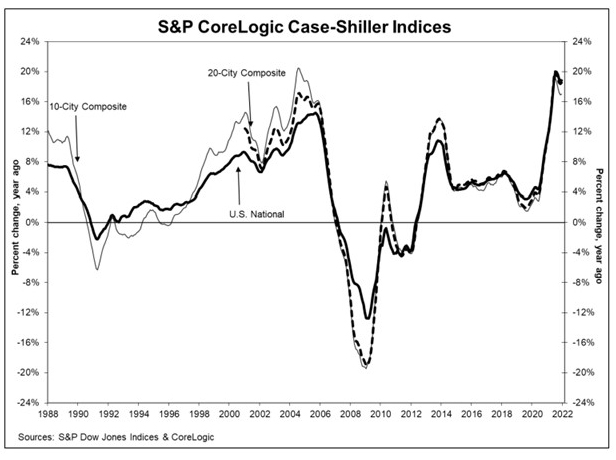
Phoenix led with a 32.5% year-over-year price increase, followed by Tampa at 29.4% and Miami at 27.3%. Fifteen of the 20 cities reported higher price increases in the year ending December from November.
Month over month, before seasonal adjustment, the U.S. National Index posted an 0.9% increase in December, while the 10-City and 20-City Composites posted increases of 1.0% and 1.1%, respectively. After seasonal adjustment, the U.S. National Index posted a 1.3% increase, while the 10-City and 20-City Composites posted increases of 1.4% and 1.5%, respectively. All 20 cities reported increases before and after seasonal adjustments.
This is the highest calendar year increase in 34 years of data, and substantially ahead of 2020’s 10.4% gain, said Craig J. Lazzara, Managing Director with S&P DJI. “We have noted that for the past several months, home prices have been rising at a very high, but decelerating rate. The deceleration paused in December, as year-over-year changes in all three composite indices were slightly ahead of their November levels.”
The report said as of December 2021, average home prices for the MSAs within the 10-City and 20-City Composites are exceeding their winter 2007 levels.
“Home buyers have not yet thrown in the towel,” said Selma Hepp, Deputy Chief Economist with CoreLogic, Irvine, Calif. “Buyers may have been rushing in anticipation of higher rates, though most recent data suggests that demand remains vigorous despite the 100 basis point increase in rates. However, as rates continue to pick up, budget-constrained buyers will face more challenges, likely leading to some waning demand.”
“The home price data support our contention that home prices are being driven by a pronounced affordability migration from higher priced metro areas to lower priced metro areas in the Mountain West and South,” said Mark Vitner, Senior Economist with Wells Fargo Economics, Charlotte, N.C. “These regions accounted for the bulk of state-to-state migration gains in 2021, and surveys from moving companies suggest inflows have accelerated more recently. The influx of buyers has pulled prices sharply higher in these regions, pricing many local buyers out of the market.”
Vitner noted the more rapid pace of home price appreciation comes at a time that existing home inventories have fallen to record lows. “The drop in existing inventories appears to be self-reinforcing,” he said. “With home prices surging, a growing proportion of homeowners would like to sell their homes. Unfortunately, more and more homeowners are reluctant to put their homes on the market for fear they will not be able to find another place to live.”
In a separate report, FHFA said U.S. house prices rose 17.5 percent year over year through the fourth Quarter. The FHFA House Price Index said house prices rose by 3.3 percent from a year ago; the seasonally adjusted monthly index for December rose by 1.2 percent from November.
“House prices continued to climb but not as rapidly during the final quarter of 2021 as in earlier quarters,” said William Doerner, Supervisory Economist in FHFA’s Division of Research and Statistics. “Housing trends over the past year have created challenges. The quick house price gains may be counterbalanced as mortgage rates increase. However, more expensive housing has elevated affordability to become a broader concern as available supply remains limited.”
The report said house prices rose in all 50 states and the District of Columbia year over year. Highest annual appreciation were: 1) Arizona 27.4 percent; 2) Utah 27.1 percent; 3) Idaho 27.0 percent; 4) Florida 25.6 percent; and 5) Tennessee 24.1 percent. Areas showing the lowest annual appreciation were: 1) District of Columbia 6.6 percent; 2) Louisiana 10.2 percent; 3) North Dakota 10.3 percent; 4) Maryland 10.8 percent; and 5) Alaska 11.3 percent.
House prices rose in all of the top 100 largest metropolitan areas over the past four quarters. Annual price increases were greatest in Cape Coral-Fort Myers, Fla., where prices increased by 34.6 percent. Prices were weakest in Frederick-Gaithersburg-Rockville, Md., where they increased by 8.5 percent.
Of the nine census divisions, the Mountain division recorded the strongest four-quarter appreciation, posting a 23.1 percent annual gain and a 3.5 percent increase in the fourth quarter. Annual house price appreciation was weakest in the West North Central division, where prices rose by 13.6 percent annually.