MBA Chart of the Week: Servicing Customer Inquiries Per Loan
This past week in Orlando, MBA held its annual Servicing Solutions Conference and Expo, attended by more than 1,300 industry professionals. Among major topics weighing on mortgage servicers were servicing technology, servicing transfers, post-forbearance workouts, customer complaints, fair servicing and regulatory compliance and borrower communications, among others.

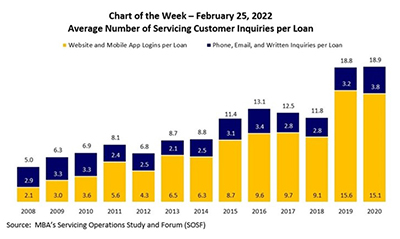
In this week’s MBA Chart of the Week, we focus on borrower communications, specifically the average number of annual servicing customer inquiries per loan. MBA has tracked this data through its Servicing Operations Study and Forum since 2008. Included in inquiries are the annual number of website and mobile applications logins, as well as the number of phone, email and written inquiries handled through a call center. These inquiries can also be viewed as borrower-initiated “touch points.”
Over the 13-year period from 2008 to 2020, the average number of touch points grew from a low of 5.0 inquiries per loan in 2008 to 18.9 inquiries per loan in 2020, primarily as the result of website and mobile application usage. Borrowers became accustomed to being online and increasingly adept in “self-service” in their everyday lives. In turn, mortgage servicers and their partners adapted to changing borrower preferences by investing in website enhancements and rolling out new mobile applications. Phone, email and written inquiries certainly did not go away, but may have become more complex – the alternative option if a borrower was unable to be self-service, such as during the early months of the pandemic.
The change in borrower communications and growth of touch points presents opportunities for mortgage servicers: increased servicing customer retention, cost reduction, improved efficiencies and other relationship building possibilities.
- Marina Walsh, CMB (mwalsh@mba.org)