MBA Chart of the Week: Missed Payments By Month (Percent)
This week’s MBA Chart of the Week chart provides a preview of newly updated pandemic-related household financial insights that MBA’s Research Institute for Housing America released this morning, Feb. 8.
RIHA analysis of the Understanding America Study data, conducted by Gary Engelhardt of Syracuse University and Mike Eriksen of the University of Cincinnati, now extends through the end of 2020 and allows us to assess how renters, mortgagors and student loan borrowers fared over the first nine months of the pandemic. Today’s sneak preview presents payment data through November .
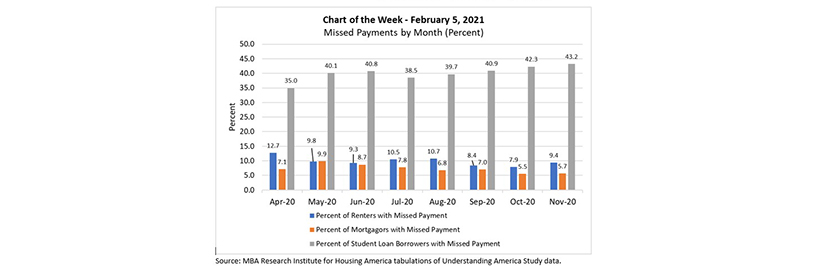
Household financial distress persisted into the fourth quarter. In November, 3.1 million renters (9.4%) and 2.7 million mortgagors (5.7%) missed payments. This is compared to a monthly average of 3.3 million renter households and 3.4 million mortgagor households in the third quarter.
We estimate that missed rental payments in October and November totaled $5 billion (vs. $6 billion in August and September) and missed mortgage payments equaled $10 billion (vs. $13.1 billion in August and September).
While the percentage of missed payments for renters and mortgagors trended (slowly) downwards in recent months, the trend for the percent of student loan borrowers with missed payments has gone in the opposite direction. 27.2 million borrowers (43.2%) missed student loan payments in November, and aggregate missed payments in October and November totaled $21.2 billion (vs. $19.9 billion in August and September).
Monday’s report will provide additional results and details through December, and will include new data on renter and mortgagor subjective expectations on evictions/foreclosures/being forced to move. Additionally, we will continue to monitor and report on pandemic-related household financial distress as people are vaccinated and the economic situation progresses.
–Edward Seiler eseiler@mba.org.