This week’s MBA Chart of the Week shows that the net wealth of the rich, the top 10% of households, increased by 3.2% between 2016 and 2019, while the net worth of the poor, the bottom 30% of households, decreased by 7.6%.
Tag: The Distribution of Wealth in America Since 2016
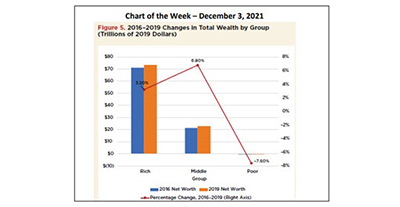
MBA Chart of the Week, Dec. 3, 2021: U.S. Household Wealth
This week’s MBA Chart of the Week shows that the net wealth of the rich, the top 10% of households, increased by 3.2% between 2016 and 2019, while the net worth of the poor, the bottom 30% of households, decreased by 7.6%.
RIHA Study: U.S. Household Net Worth Up 17.6% Between 2016-2019
The median net worth of U.S. households increased from $103,000 in 2016 to $127,000 in 2019 – a gain of 17.6% and the highest amount since 2007, according to The Distribution of Wealth in America Since 2016, a new report released Thursday by the Mortgage Bankers Association’s Research Institute for Housing America.