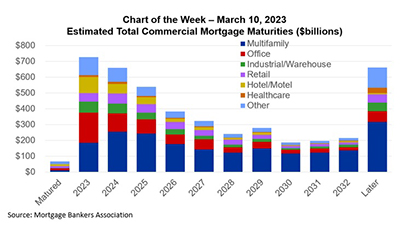
At MBA’s CREF Convention in San Diego last month, we released the results of our annual survey of upcoming commercial and multifamily mortgage maturities. The survey collects information directly from loan servicers on when the loans they service mature.
Tag: MBA Chart of the Week
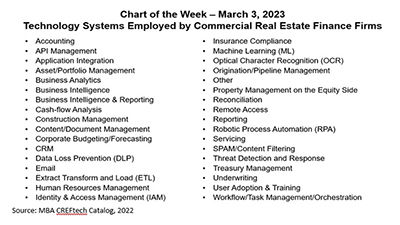
MBA Chart of the Week: Tech Systems Employed by Commercial Real Estate Finance Firms
Lenders closed $800 billion in mortgages backed by income-producing commercial and multifamily properties in 2022–adding to what is now almost $4.4 trillion in outstanding loans.
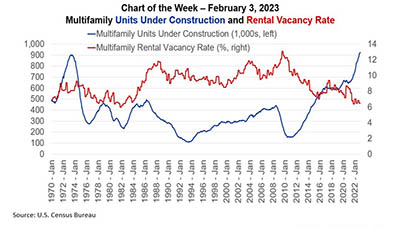
MBA Chart of the Week Feb. 9, 2023: Multifamily Construction/Vacancies
At the end of this week, many of us will begin our annual migration to San Diego and to MBA’s Commercial/Multifamily Finance Convention & Expo (CREF23). There will be no lack of topics to discuss – from return to the office, to the return of retail, and interest in cap rates to interest rate caps.
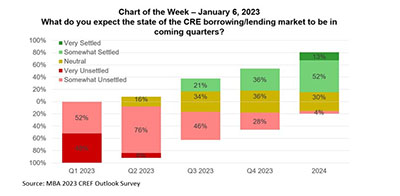
MBA Chart of the Week Jan. 12, 2023: CRE Lending/Borrowing
Commercial real estate markets are entering 2023 amid a great deal of uncertainty and, as a result, a significant slowdown in activity. Leaders of top commercial real estate finance firms believe that overall uncertainty will dissipate over the course of the year, but with a host of factors that will drag – rather than boost – the markets in 2023.
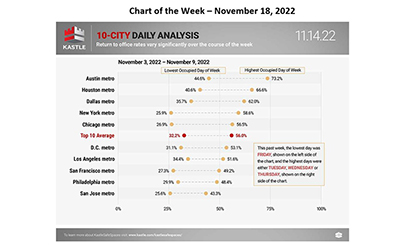
MBA Chart of the Week Dec. 1, 2022: Return to Office Rates
Thanks to a very tight labor market and technological advances, hybrid work reigns two and a half years after the onset of the COVID-19 pandemic, with employees at many companies coming into the office a few days a week. The extent to which this trend will continue – and what it means for the office market – will depend on employees’ and employers’ costs and benefits of being in the office versus remote and whether a transition to a looser labor market tilts the bargaining table to employers and their preference for more in-person collaboration.
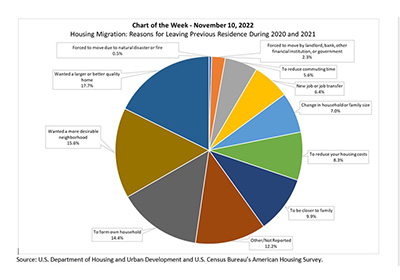
MBA Chart of the Week Nov. 17: Housing Migration
The biennial American Housing Survey, the most comprehensive national housing survey in the United States, provides detailed data on housing migration. These data include responses on the distance of the move, tenure of the respondent’s previous residence and reasons for leaving one’s previous residence.

MBA Chart of the Week: Mortgage Payment to Rent Ratio
MBA recently released its September Purchase Applications Payment Index data, which revealed that homebuyer affordability took a large hit in September, with the 75-basis-point jump in mortgage rates leading to the typical homebuyer’s monthly payment rising $102 to $1,941.
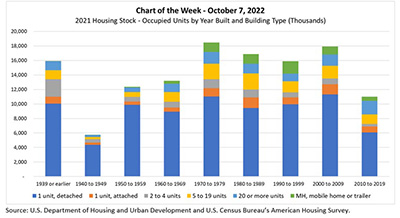
MBA Chart of the Week Oct. 13, 2022: 2021 Housing Stock
At the end of September, HUD and the Census Bureau released 2021 American Housing Survey summary table estimates in the AHS Table Creator and 2021 AHS National and Metro Public Use File microdata. The AHS, last updated with 2019 data, is the “most comprehensive national housing survey in the United States,” and provides information about the quality and cost of housing, including data on “the physical condition of homes and neighborhoods, the costs of financing and maintaining homes, and the characteristics of people who live in these homes.”
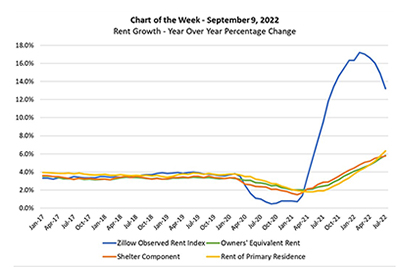
MBA Chart of the Week: Rent Growth–Year-over-Year Percentage Change
This week’s MBA Chart of the Week highlights a question related to housing costs and inflation: If home price appreciation and rent growth have been in double digits in the past few quarters—as highlighted by the (blue lined) Zillow Observed Rent Index in the chart—why is the shelter component (orange line) of the Consumer Price Index below 6%?
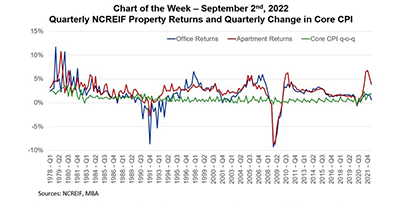
MBA Chart of the Week: Quarterly NCREIF Property Returns
Federal Reserve Board Chair Jerome Powell warned at Jackson Hole, Wyo., last month, “Inflation is running well above 2 percent, and high inflation has continued to spread through the economy. While the lower inflation readings for July are welcome, a single month’s improvement falls far short of what the Committee will need to see before we are confident that inflation is moving down.”