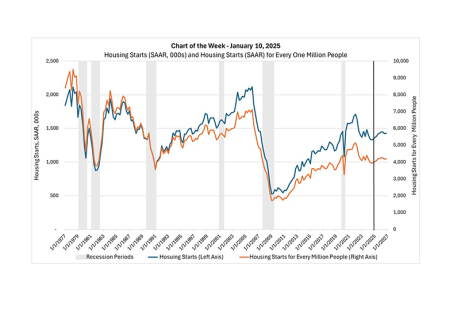
In this week’s MBA Chart of the Week, we look at one statistic–aggregate single-family and multifamily housing starts–and examine how it has evolved since the start of the Carter Administration.
Tag: MBA Chart of the Week
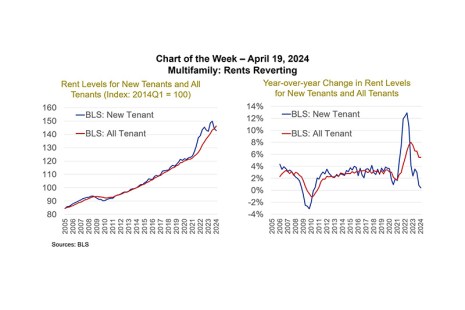
MBA Chart of the Week–Multifamily: Rents Reverting
The pandemic did a number on the housing market.
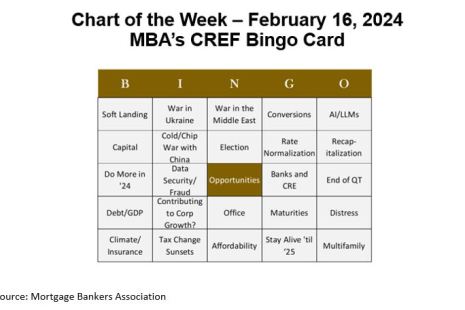
Chart of the Week: MBA’s CREF Bingo Card
Many of us recently returned from a week in San Diego at MBA’s Commercial Real Estate/Multifamily Finance Convention and Expo, where 2,000-plus CRE mortgage professionals gathered to hear from speakers, discuss policy issues, network, and – most importantly – begin the year’s deal-making in earnest.

MBA Chart of the Week: FOMC Summary of Economic Projections for Fed Funds Rate
In this week’s MBA Chart of the Week, we track changes in policymakers’ quarterly published SEP federal funds rate forecasts over the last eleven quarters.
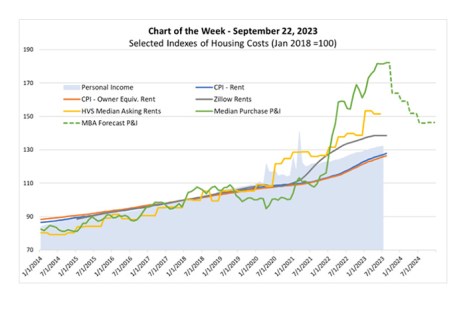
MBA Chart of the Week: Selected Indexes of Housing Costs
The monthly cost burden of purchasing a new home, as interest rates and house prices rose precipitously in 2022, continued in the first few months of 2023. For example, MBA’s Purchase Applications Payment Index (PAPI), hit a new high in May. Since then, despite 30-year mortgage interest rates eclipsing 7%, the index has come down slightly as median loan application amounts moderated. We are, however, still in record territory as shown by the solid green line in this week’s chart.
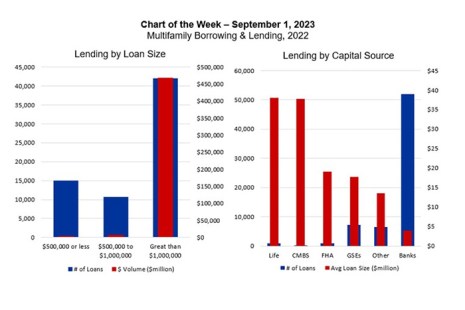
MBA Chart of the Week: Multifamily Borrowing and Lending, 2022
With more than $4.5 trillion of mortgage debt outstanding, commercial real estate finance markets are large and diverse.
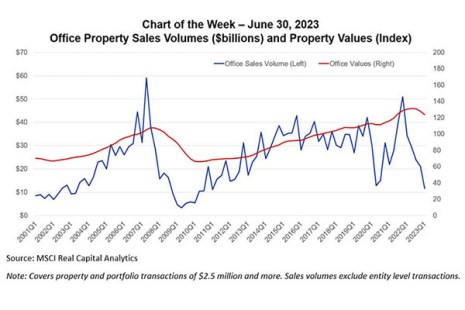
MBA Chart of the Week July 6, 2023: Office Property Sales Volumes and Values
In commercial real estate, all eyes remain on the office market. That is despite the fact that multifamily mortgage debt – accounting for $2.0 trillion of the $4.6 trillion of total outstanding — is almost three times as large and office accounts for just 17 percent of total CRE debt.
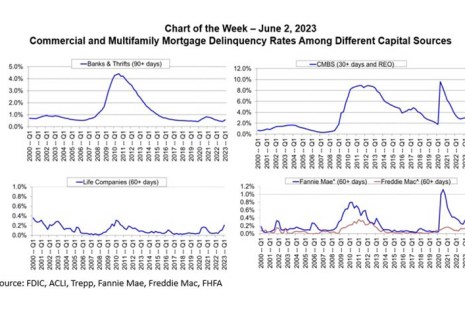
MBA Chart of the Week: Commercial and Multifamily Delinquency Rates Among Capital Sources
Ongoing stress caused by higher interest rates, uncertainty around property values and questions about fundamentals in some property markets are beginning to show up in commercial mortgage delinquency rates.
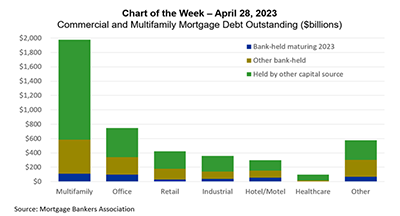
MBA Chart of the Week: Commercial and Multifamily Mortgage Debt Outstanding
Two questions have dominated the CRE headlines of late: a) the reliance of banks on commercial real estate and b) the reliance of commercial real estate on banks. We addressed the former in a previous Chart of the Week. Here we look at the latter with a particular focus on office — the property type attracting the greatest scrutiny.
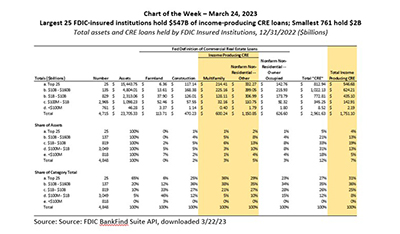
MBA Chart of the Week, Mar. 30, 2023: CRE Loans/FDIC-Insured Institutions
There is, not inappropriately, a great deal of attention being paid to commercial real estate right now. And with that attention come a lot of different questions and answers—with many answers varying depending on how one defines things.