According to the latest results from MBA’s National Delinquency Survey (NDS) released last week, the overall delinquency rate for mortgage loans on one‐to‐four‐unit residential properties increased to a seasonally adjusted rate of 3.97% of all loans outstanding at the end of the second quarter of 2024. The delinquency rate was up 60 basis points from one year ago.
Tag: MBA Chart of the Week
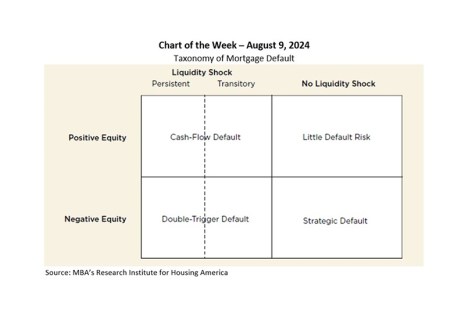
MBA Chart of the Week: Taxonomy of Mortgage Default
Recently, the Research Institute for Housing America (RIHA), MBA’s think tank, released a special report, Mortgage Design, Underwriting, and Interventions: Promoting Sustainable Homeownership, that looks at the lessons learned from the Great Financial Crisis, the Covid-19 pandemic, and other past episodes of default, to understand how to design a more robust mortgage system that proactively supports sustainable homeownership.

MBA Chart of the Week: Monthly Payroll Growth and Unemployment Rate
The job market definitively slowed in July. Nonfarm payroll growth at 114,000 was well below the 12-month average of 215,000, while the unemployment rate moved up to its highest level since October 2021 at 4.3%, as shown in this week’s chart.
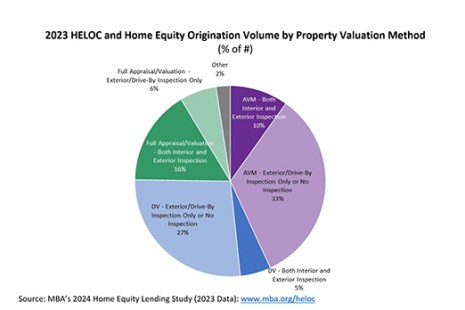
Chart of the Week: 2023 HELOC and Home Equity Origination Volume by Valuation Method
MBA recently completed its 2024 Home Equity Lending Study (covering 2023 data) tracking trends in origination and servicing operations for home equity lines of credit (HELOCs) and home equity loans.
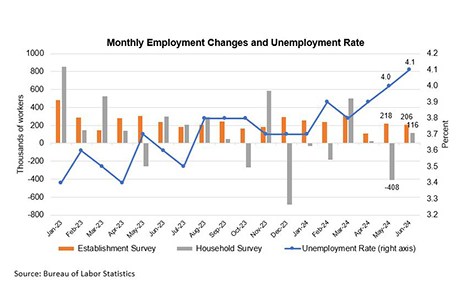
x MBA Chart of the Week: Monthly Employment Changes and Unemployment Rate
Once again, the headline gain in nonfarm payroll employment does not tell the entire story.

MBA Chart of the Week: Monthly Employment Changes and Unemployment Rate
Once again, the headline gain in nonfarm payroll employment does not tell the entire story.
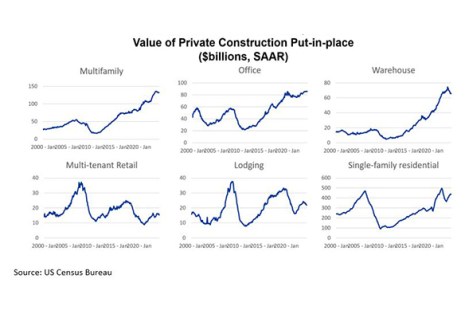
MBA Chart of the Week: Value of Private Construction Put-in-Place
Physicists have protons, neutrons, and electrons. Biologists have DNA and RNA. And economists have supply and demand — the building blocks upon which most of our understanding of markets rest.

Chart of the Week: Annual Cost of Servicing Performing and Non-Performing Loans
MBA’s annual Servicing Operations Study and Forum includes a deep-dive analysis and discussion of servicing costs, productivity, and portfolio characteristics for in‐house single-family servicers, representing about 60 percent of the single-family servicing market. Based on the most recent completed study cycle, fully-loaded servicing costs remained flat relative to the previous year at an average of $237 per loan. But that only tells part of the story.

MBA Chart of the Week: 30-Year Fixed Mortgage Rate and 10-Year Treasury Yield
This week’s Chart of the Week examines the spread between the 30-year fixed mortgage rate and 10-year Treasury yield.
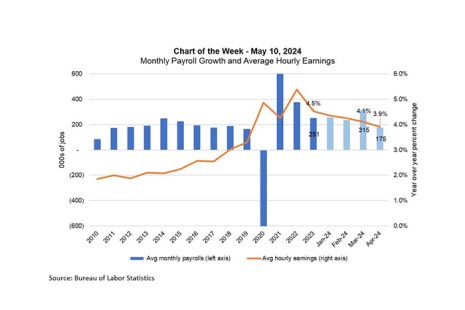
MBA Chart of the Week: Monthly Payroll Growth, Average Hourly Earnings
The Federal Open Market Committee (FOMC) left the federal funds target unchanged at its May meeting, as incoming data regarding the strength of the economy and stubbornly high inflation have resulted in a shift in the expected timing of a first rate cut.

