
Job growth slowed to just 22,000 jobs in August and estimates for the prior two months were revised down by 21,000.
Tag: Joel Kan

Jobs Up by 73,000 in July Amid May, June Revisions; Industry Economists Weigh In
Total nonfarm payroll employment increased by 73,000 in July and the unemployment rate stood at 4.2%, the U.S. Bureau of Labor Statistics reported Aug. 1.
MBA Chart of the Week: Monthly Payroll Growth, Unemployment Rates
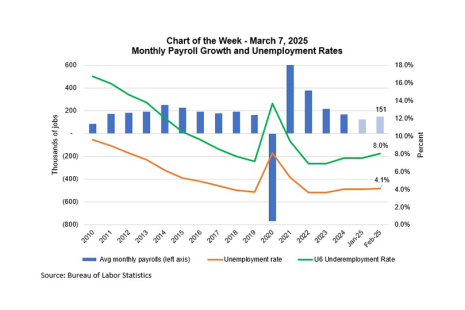
The job market softened somewhat in February, with the unemployment rate increasing to 4.1%, the pace of private sector job growth up by 140,000, and wage growth steady at 4%.

MBA Chart of the Week: Monthly Payroll Growth and Unemployment Rate
The job market definitively slowed in July. Nonfarm payroll growth at 114,000 was well below the 12-month average of 215,000, while the unemployment rate moved up to its highest level since October 2021 at 4.3%, as shown in this week’s chart.
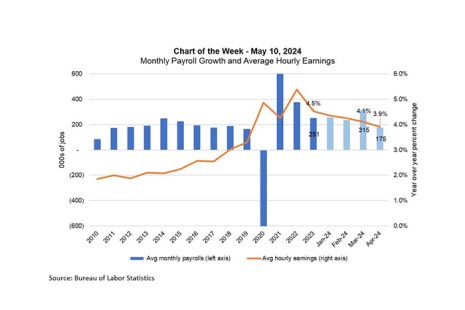
MBA Chart of the Week: Monthly Payroll Growth, Average Hourly Earnings
The Federal Open Market Committee (FOMC) left the federal funds target unchanged at its May meeting, as incoming data regarding the strength of the economy and stubbornly high inflation have resulted in a shift in the expected timing of a first rate cut.
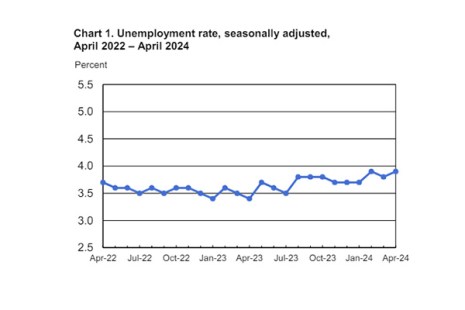
Jobs Report: U.S. Economy Adds 175,000 in April
Total nonfarm payroll employment increased by 175,000 in April, per the Bureau of Labor Statistics.

GDP Grew at 1.6% in Q1; Industry Economists Weigh In
Real gross domestic product increased at an annual rate of 1.6% in the first quarter, per the advance estimate released by the Bureau of Economic Analysis.
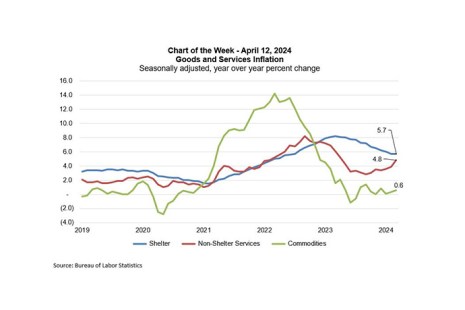
MBA Chart of the Week: Goods and Services Inflation
The week’s news has been around the Consumer Price Index (CPI) release showing that inflation was hotter than expected in March, which is likely to delay the Federal Reserve’s first rate cut in 2024 and contributed to a significant spike in the 10-year Treasury yield to over 4.5%.

Economic Outlook: ‘Some Momentum’ Going into 2024–#MBAServicing24
ORLANDO–The U.S. economy was stronger in 2023 than most analysts expected, according to Joel Kan, Vice President and Deputy Chief Economist with the Mortgage Bankers Association.

MBA: Mortgage Credit Availability Increased in January
Mortgage credit availability increased in January according to the Mortgage Credit Availability Index, a report from the Mortgage Bankers Association that analyzes data from ICE Mortgage Technology.