
Job growth slowed to just 22,000 jobs in August and estimates for the prior two months were revised down by 21,000.
Tag: Chart of the Week

Chart of the Week: Mortgage Industry Employment
This Chart of the Week focuses on trends in mortgage industry employment and appropriately coincides with Labor Day and MBA’s upcoming Human Resources Symposium. In this chart, we focus on three different measurements of mortgage employment from three different sources.

Chart of the Week: Composition of Seriously Delinquent Loans by Origination Year
According to the latest results from MBA’s National Delinquency Survey (NDS), the delinquency rate for mortgage loans on one-to-four-unit residential properties decreased slightly to a seasonally adjusted rate of 3.93 percent of all loans outstanding at the end of the second quarter of 2025. The delinquency rate was down 11 basis points from the first quarter of 2025 and down 4 basis points from one year ago.
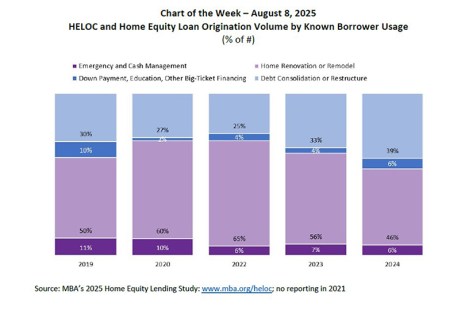
Chart of the Week: HELOC and Home Equity Loan Origination Volume by Known Borrower Usage
MBA recently completed its 2025 Home Equity Lending Study, tracking trends in origination and servicing for home equity lines of credit (HELOCs) and home equity loans. According to the study, total originations of open-end home equity lines of credit (HELOCs) and closed-end home equity loans increased in 2024 by 7.2% from the previous year when comparing originators that reported in both years. Total HELOC and home equity loan debt outstanding grew 10.3%.

Chart of the Week: 2024 HMDA Respondents
A total of 4,758 companies reported lending activity under the Home Mortgage Disclosure Act (HMDA) in 2024, according to MBA’s analyses of the dataset.

Chart of the Week: Cost of Servicing Performing and Non-Performing Loans
Based on results from MBA’s latest Servicing Operations Study and Forum (SOSF), fully-loaded mortgage servicing costs of performing loans averaged $176 per loan in 2024, while the costs of non-performing loans averaged $1,573 per loan.

Chart of the Week: Selected Indexes of Housing Costs
The elevated cost burden of purchasing a new home since interest rates rose precipitously in 2022, has continued through mid-2025.

Chart of the Week: Average Wage Growth for Job Stayers Vs. Switchers
Given the current economic uncertainty, a lot of attention is being paid to the health of the labor market. Overall, it is fair to say that the job market is still healthy but continues to weaken. Based on the Bureau of Labor Statistics’ Employment Situation report, job growth came in at 147,000 in June, matching the average pace for the past year. The unemployment rate remained steady at 4.1%, but the participation rate dropped again, as workers continued to leave the workforce.

Chart of the Week: Target and Projected Fed Funds Rate
Federal Open Market Committee (FOMC) projections from the June 2025 meeting show that members expect increases in both the unemployment rate and inflation throughout the course of this year, as well as slightly weaker economic growth.
Chart of the Week: SERC Mortgage Credit Risk Index
An updated measure of GSE-eligible credit risk was recently released by the Smith Enterprise Risk Consortium (SERC) at the University of Maryland’s Robert H. Smith School of Business.