
Independent mortgage banks (IMBs) and mortgage subsidiaries of chartered banks reported a pre-tax net production profit of 17 basis points (or $674 per originated loan) in the fourth quarter of 2025, according to the Mortgage Bankers Association’s (MBA) newly released Quarterly Mortgage Bankers Performance Report.
Tag: Chart of the Week

Chart of the Week: Monthly Payroll Growth and Unemployment Rates
In 2025, job growth slowed to a crawl as the economy added an average of 10,000 jobs per month, and what little growth there was came from just a few sectors, notably health care.
Chart of the Week: Mortgage Delinquency Rate by Loan Type
According to MBA’s National Delinquency Survey, mortgage delinquencies increased across all three major loan types–Conventional, FHA, and VA–in the last three months of the year.
Chart of the Week: Homeownership Rates by Age, Race and Ethnicity
In this week’s MBA Chart of the Week, we examine the homeownership rate by household age as well as by race and ethnicity.
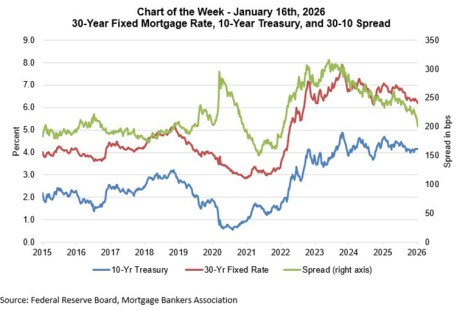
Chart of the Week: Mortgage Rates, 10-Year Treasury and 30-10 Spread
The spread between mortgage rates and Treasury rates is impacted by several factors, including the level of interest rate volatility and the relative demand/supply balance of the two types of securities. In recent months, rate volatility has diminished, as the future course of monetary policy has become clearer and financial markets have been relatively calm. Last week’s announcement that the GSEs will increase their purchases of MBS brought the spread in further, and mortgage rates dropped further over the course of the week.
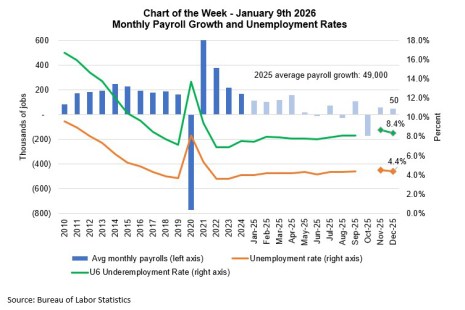
MBA Chart of the Week: Monthly Payroll Growth
The pace of employment growth slowed in December to 50,000 jobs, in line with the average pace of 49,000 for all of 2025. Employment growth was much slower than the roughly 168,000 job pace in 2024. Employment numbers for October and November were revised downwards by 76,000, considerably weaker than initially reported.
Chart of the Week: Employee Benefits Costs for Mortgage Lenders, Servicers
The beginning of the calendar year brings changes to employee benefits and associated costs for both mortgage company employers and employees. Based on data collected through the MBA and STRATMOR Peer Group Roundtables Program, this week’s Chart of the Week shows that residential lender-paid and servicer-paid costs have generally increased over the past five years, from 2020 to the first half of 2025, at a faster pace than the previous five years, from 2015 to 2020.
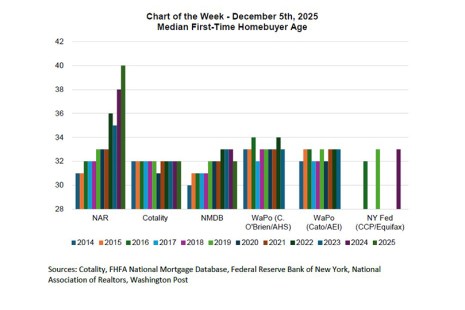
Chart of the Week: Median First-Time Homebuyer Age
The Washington Post recently published an article examining alternative estimates of first-time homebuyers’ age. MBA members have asked about this data, so this week’s Chart of the Week explores the Post’s analysis and current FTHB data trends.
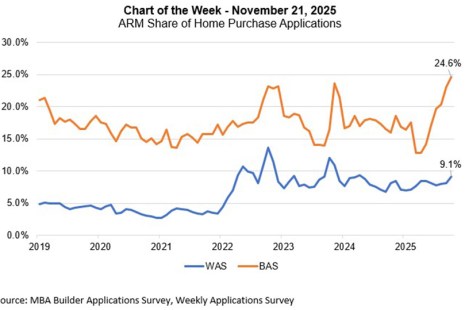
Chart of the Week: ARM Share of Home Purchase Applications
According to data from MBA’s Builder Applications Survey, 24.6% of applications to purchase a newly built home were adjustable rate mortgage (ARM) loan applications in October.
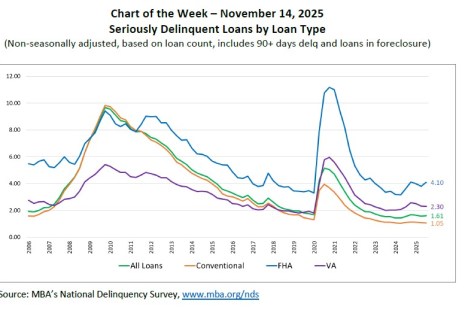
Chart of the Week: Seriously Delinquent Loans by Loan Type
According to the latest MBA National Delinquency Survey, the delinquency rate for mortgage loans on one-to-four-unit residential properties increased to a seasonally adjusted rate of 3.99% of all loans outstanding at the end of the third quarter of 2025.