In this Chart of the Week, we compare in basis points the average quarterly credit spreads between the 30‐year mortgage rate (as surveyed by Freddie Mac) and the 10‐year Treasury yield to production revenues (fee income, secondary marketing income and warehouse spread).
Tag: MBA Chart of the Week
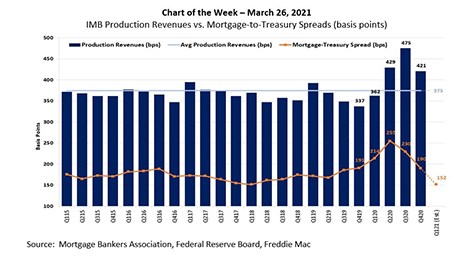
MBA Chart of the Week Mar. 26, 2021: IMB Production Revenues
In this Chart of the Week, we compare in basis points the average quarterly credit spreads between the 30‐year mortgage rate (as surveyed by Freddie Mac) and the 10‐year Treasury yield to production revenues (fee income, secondary marketing income and warehouse spread).
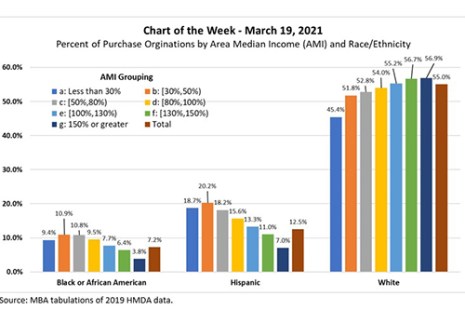
MBA Chart of the Week: Percent of Originations by Median Income, Race/Ethnicity
We analyzed the 2019 Home Mortgage Disclosure Act data for the 30 largest metropolitan statistical areas to understand the distributions of first lien mortgage purchase originations by Area Median Income and by race/ethnicity.
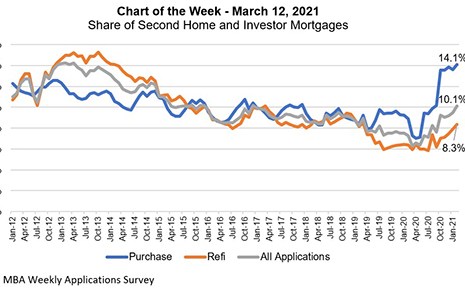
MBA Chart of the Week, Mar. 15, 2021: Share of Second Home & Investor Mortgages
This week’s MBA Chart of the Week captures the share of mortgage applications to purchase or refinance a second home or investment property.
MBA Chart of the Week, Mar. 15, 2021: Share of Second Home & Investor Mortgages
This week’s MBA Chart of the Week captures the share of mortgage applications to purchase or refinance a second home or investment property.
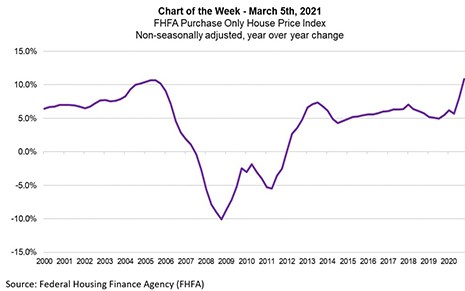
MBA Chart of the Week Mar. 5 2021: FHFA Purchase-Only Index
The rate of U.S. home-price appreciation continues to be driven higher by a combination of strong demand for housing and record-low housing inventory for sale. The Federal Housing Finance Agency’s most recent release showed the fourth quarter saw annual home-price growth of 10.9 percent –the strongest annual change on record. The previous high was an increase of 10.7 percent in third quarter 2005.
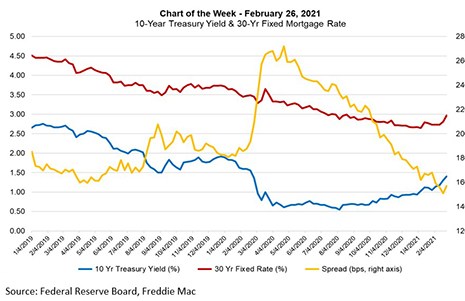
MBA Chart of the Week: 10-Year Treasuries and 30-Year Fixed Rates
This week’s chart shows the recent climb in rates, and the spread between the 30-year mortgage rate, as surveyed by Freddie Mac, and the 10-year Treasury yield. As the 10-year has risen, so has the 30-year fixed rate, which has gone up 24 basis points since the beginning of February.