MBA Chart of the Week: Homeownership Rates
Source: U.S. Census Bureau’s American Community Survey 1-Year Estimates.
In mid-September, the U.S. Census Bureau released its 2023 American Community Survey (ACS) 1-year estimates. The ACS data, updated annually, provides detailed information about “jobs and occupations, educational attainment, veterans, whether people own or rent their homes,” and other information that allows public officials, planners, and entrepreneurs “to assess the past and plan the future.”
While other sources, such as the Census’ quarterly survey on Housing Vacancies and Homeownership (HVS), also provides details on whether people own or rent their homes, the ACS’s coverage gives us the ability to drill-down to look at homeownership rates by geography and various demographic characteristics. In this week’s MBA Chart of the Week, we show homeownership rates by race and ethnicity and by the age of the householder for eight ACS survey waves since 2011.
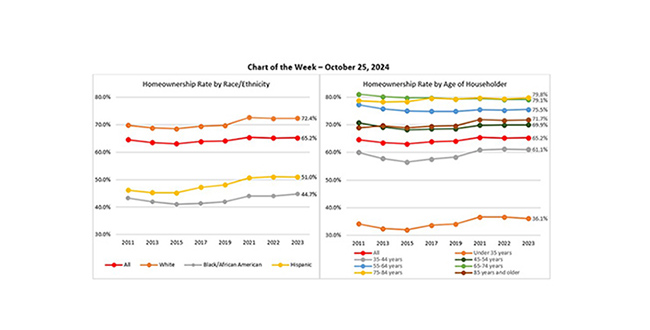
The left panel shows that after the Great Financial Crisis, the overall homeownership rate (red line) fell by 1.6% from 2011 to 2015, to 63.0%, but recovered to reach 65.4% in 2021. It then retreated slightly to 65.2% in both the 2022 and 2023 surveys. When we drill-down by race, the chart highlights that the homeownership gap between Black and White households remains wide. Indeed, it increased from 26.6% in 2011 to 28.6% in 2021, and while the gap has declined over the last two surveys, it is still 27.7% —more than a point higher than it was 12 years earlier.
The right panel shows the large 25% difference in homeownership rates between households under 35 years and those 35-44 years old. While this discrepancy has remained over the eight survey waves shown, the question remains whether the large millennial and older gen-Z cohorts will want to and be able to transition to homeownership as previous age cohorts have. While many authors indicate that younger cohorts indeed want to transition, their ability may be hampered by a lack of supply. This is exemplified in the chart by limited filtering from older cohorts—homeownership rates for 75–84-year-olds increased from 78.7% in 2011 to 79.8% in 2023 (yellow line), and more households ages 85 years and older have chosen to age-in-place with their homeownership rates increasing from 68.9% in 2011 to 71.7% in 2023 (brown line).
While there are many issues that these charts raise, I highlight two positive developments. First, regarding the stubbornly high homeownership gap, MBA recently announced the formation of the CONVERGENCE Collaborative, in which MBA and 13 leading industry stakeholders will make a coordinated effort to identify and develop solutions to address the racial homeownership gap. Second, regarding the supply of homes for millennials to purchase, MBA’s Builder Application Survey shows that “applications for new home purchases continue to show year-over-year growth, increasing by more than four percent and extending the annual growth streak to 19 consecutive months.” Moreover, the National Association of Realtors existing home sales inventories have increased every month since December 2023 and are up 22.7% from a year earlier.