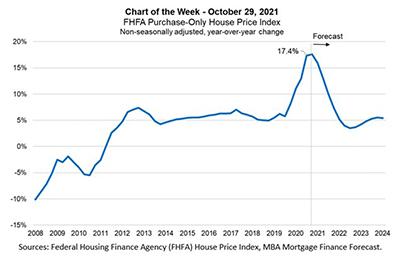
This week’s MBA Chart of the Week shows FHFA’s quarterly, non-seasonally adjusted year-over-year HPA starting from the fourth quarter of 2008 through the second quarter of 2021, together with MBA’s quarterly forecast through the end of 2024.
Tag: MBA Chart of the Week
MBA Chart of the Week: FHFA Purchase-Only Price Index
This week’s MBA Chart of the Week shows FHFA’s quarterly, non-seasonally adjusted year-over-year HPA starting from the fourth quarter of 2008 through the second quarter of 2021, together with MBA’s quarterly forecast through the end of 2024.
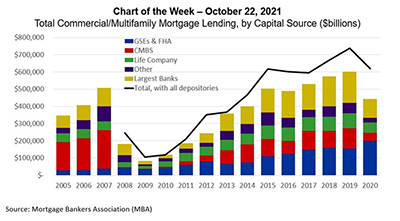
MBA Chart of the Week Oct. 25 2021: Commercial/Multifamily Lending
Sometimes research is like putting a puzzle together – trying to fit one piece of information with another to create a full picture of what’s happening. This week, we are adding a new, final piece to the puzzle of how much commercial real estate lending happens each year.
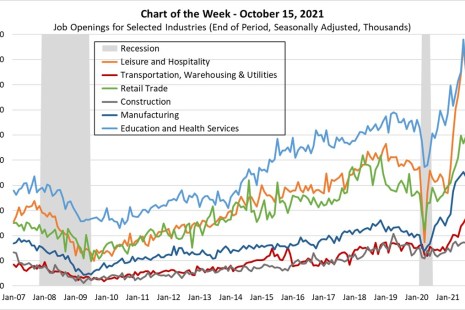
MBA Chart of the Week Oct. 18, 2021–Job Openings for Selected Industries
The U.S. Bureau of Labor Statistics’ Job Openings and Labor Turnover Survey (JOLTS) data for August continues to show that many employers are running into difficulty re-hiring and filling open positions.
MBA Chart of the Week Oct. 18, 2021–Job Openings for Selected Industries
The U.S. Bureau of Labor Statistics’ Job Openings and Labor Turnover Survey (JOLTS) data for August continues to show that many employers are running into difficulty re-hiring and filling open positions.
MBA Chart of the Week Oct. 11, 2021–Monthly Payroll Growth
Friday’s Employment Situation Summary from the U.S. Bureau of Labor Statistics indicated that job growth remained lackluster in September following similarly disappointing gains in August.
MBA Chart of the Week Oct. 11, 2021–Monthly Payroll Growth
Friday’s Employment Situation Summary from the U.S. Bureau of Labor Statistics indicated that job growth remained lackluster in September following similarly disappointing gains in August.
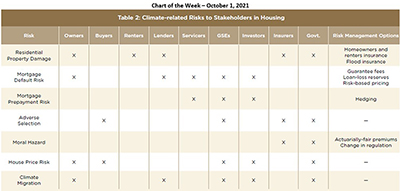
MBA Chart of the Week Oct. 4, 2021
This week’s MBA Chart of the Week lists risks that will likely increase or change because of climate change along with an indication of impacted stakeholders.
MBA Chart of the Week Oct. 4, 2021
This week’s MBA Chart of the Week lists risks that will likely increase or change because of climate change along with an indication of impacted stakeholders.
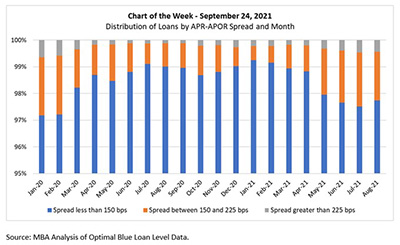
MBA Chart of the Week, Sept. 24, 2021: Distribution of Loans by APR-APOR Spread & Month
In this week’s MBA Chart of the Week, we analyze Optimal Blue single-family, 30-year fixed mortgage rate origination loan data from January 2020 through August 2021. We further group loans in the chart by the spread between their reported note rate and the (monthly average of the) Freddie Mac Primary Mortgage Market Survey rates to approximate the APR-APOR spread.