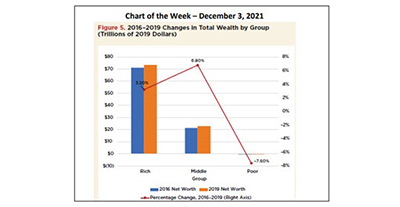
This week’s MBA Chart of the Week shows that the net wealth of the rich, the top 10% of households, increased by 3.2% between 2016 and 2019, while the net worth of the poor, the bottom 30% of households, decreased by 7.6%.
Tag: MBA Chart of the Week
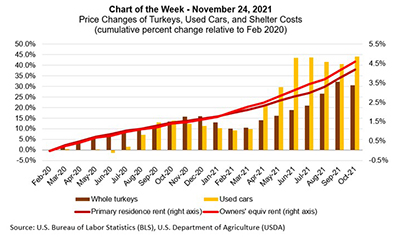
MBA Chart of the Week Nov. 24, 2021: Price Changes in Turkeys, Cars, Shelter
Inflation has been a dominant story of late, given the widespread disruption in supply chains and labor shortages resulting from the pandemic.
MBA Chart of the Week Nov. 24, 2021: Price Changes in Turkeys, Cars, Shelter
Inflation has been a dominant story of late, given the widespread disruption in supply chains and labor shortages resulting from the pandemic.
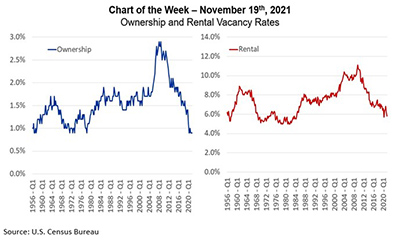
MBA Chart of the Week: Ownership & Rental Vacancy Rates
The U.S. housing stock is full.
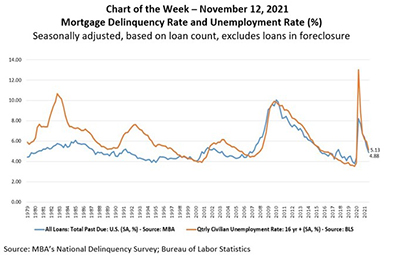
MBA Chart of the Week Nov. 12, 2021: Mortgage Delinquency Rate & Unemployment Rate
The delinquency rate for mortgage loans on one‐to‐four‐unit residential properties fell to a seasonally adjusted rate of 4.88 percent of all loans outstanding at the end of the third quarter, according to the Mortgage Bankers Association’s National Delinquency Survey, released last week.
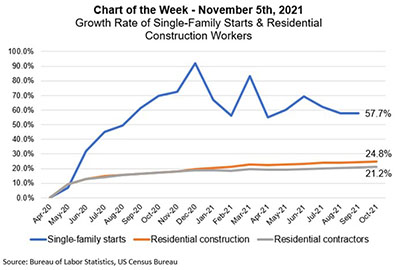
MBA Chart of the Week Nov. 5 2021: Single-Family Starts, Residential Construction Workers
This week’s MBA Chart of the Week examines the growth rates of single-family construction and residential construction workers since the trough in home building activity in April 2020.
MBA Chart of the Week Nov. 5 2021: Single-Family Starts, Residential Construction Workers
This week’s MBA Chart of the Week examines the growth rates of single-family construction and residential construction workers since the trough in home building activity in April 2020.
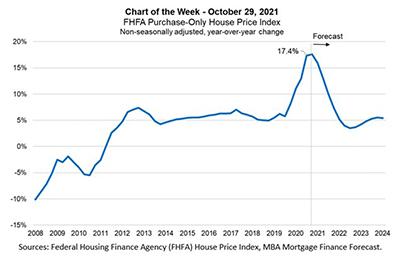
MBA Chart of the Week: FHFA Purchase-Only Price Index
This week’s MBA Chart of the Week shows FHFA’s quarterly, non-seasonally adjusted year-over-year HPA starting from the fourth quarter of 2008 through the second quarter of 2021, together with MBA’s quarterly forecast through the end of 2024.
MBA Chart of the Week: FHFA Purchase-Only Price Index
This week’s MBA Chart of the Week shows FHFA’s quarterly, non-seasonally adjusted year-over-year HPA starting from the fourth quarter of 2008 through the second quarter of 2021, together with MBA’s quarterly forecast through the end of 2024.