
Independent mortgage banks and mortgage subsidiaries of chartered banks reported a net gain of $2,023 on each loan they originated in the second quarter, down from $3,361 per loan in the first quarter, the Mortgage Bankers Association reported Tuesday in its Quarterly Mortgage Bankers Performance Report.
Tag: Marina Walsh CMB
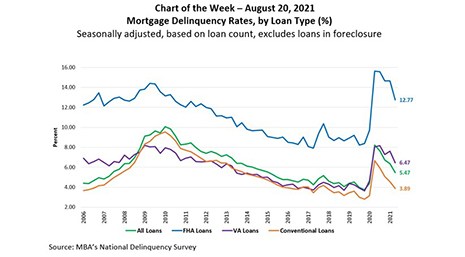
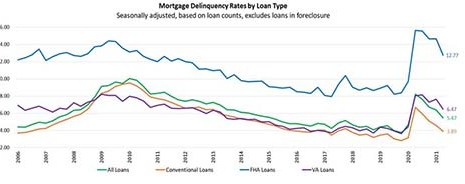
MBA Chart of the Week Aug. 23 2021: Mortgage Delinquency Rates, by Loan Type (%)
This week’s MBA Chart of the Week takes a look at mortgage delinquency rates by loan type (%) since 2006.
MBA Chart of the Week Aug. 23 2021: Mortgage Delinquency Rates, by Loan Type (%)
This week’s MBA Chart of the Week takes a look at mortgage delinquency rates by loan type (%) since 2006.
MBA Seeks Participants in New Diversity, Equity and Inclusion Study
The Mortgage Bankers Association introduces a new offering to its members — the Diversity, Equity and Inclusion (DEI) Study — separately designed and compiled for both the residential and commercial/multifamily sides of the real estate finance industry.
MBA: 2Q Mortgage Delinquencies Fall to One-Year Low
The Mortgage Bankers Association on Thursday released its Second Quarter National Delinquency Survey, showing the delinquency rate for mortgage loans on one-to-four-unit residential properties fell to a seasonally adjusted rate of 5.47 percent of all loans outstanding—the lowest rate since first-quarter 2020.
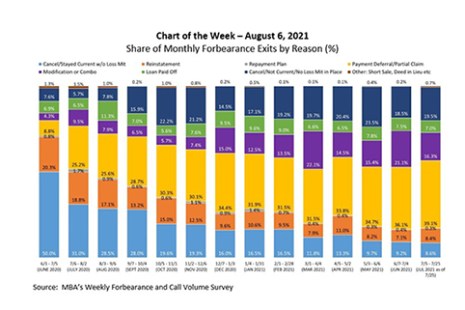
MBA Chart of the Week Aug. 9, 2021: Share of Monthly Forbearance Exits by Reason
According to MBA’s Weekly Forbearance and Call Volume Survey, the share of loans in forbearance dropped to 3.47 percent of servicers’ portfolio volume as of July 25, 2021, from a peak of 8.55 percent as of June 7, 2020. While the number of borrowers exiting forbearance has fluctuated from one month to the next, with the largest number of reported exits in July and October of last year, the post-forbearance outcomes for borrowers have differed.
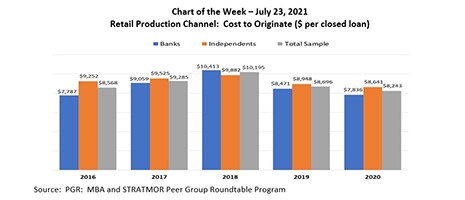
MBA Chart of the Week July 23 2021: Retail Production Channel Cost to Originate
In this week’s MBA Chart of the Week, we focus on the production costs in the retail channel. The cost to originate averaged $8,243 per loan in 2020, a $453 per loan improvement over 2019.
MBA Chart of the Week July 23 2021: Retail Production Channel Cost to Originate
In this week’s MBA Chart of the Week, we focus on the production costs in the retail channel. The cost to originate averaged $8,243 per loan in 2020, a $453 per loan improvement over 2019.