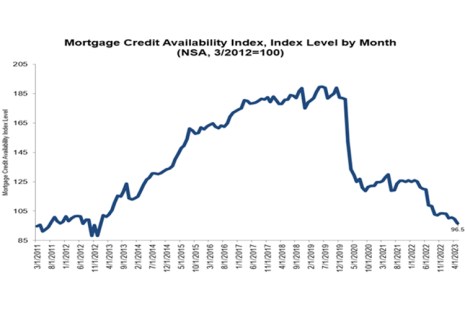
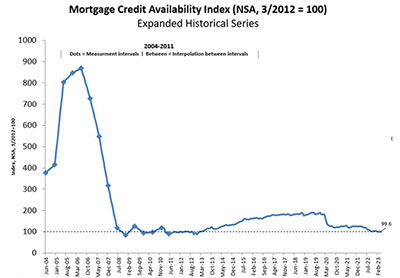
Mortgage credit availability fell in May, the Mortgage Bankers Association reported Tuesday.
Tag: Joel Kan
May Mortgage Credit Availability
Mortgage credit availability to come.

MBA Weekly Survey May 24, 2023: Mortgage Applications Decrease
Mortgage applications fell again last week, the Mortgage Bankers Association reported Wednesday in its Weekly Mortgage Applications Survey for the week ending May 19.
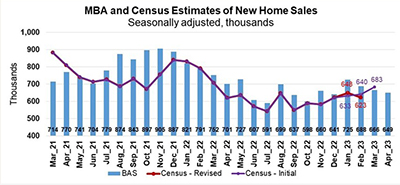
MBA: April New Home Purchase Mortgage Applications Down 11% from March; Up 4.1% from Year Ago
The Mortgage Bankers Association said April mortgage applications for new home purchases fell by 11 percent from March but rose by 4.1 percent from a year ago.
MBA: April New Home Purchase Mortgage Applications Down 11% from March; Up 4.1% from Year Ago
The Mortgage Bankers Association said April mortgage applications for new home purchases fell by 11 percent from March but rose by 4.1 percent from a year ago.
MBA Weekly Survey May 17, 2023: Rates Up, Applications Down
Mortgage applications fell last week as interest rates rose, the Mortgage Bankers Association reported Wednesday in its Weekly Mortgage Applications Survey for the week ending May 12.
MBA Weekly Survey May 17, 2023: Rates Up, Applications Down
Mortgage applications fell last week as interest rates rose, the Mortgage Bankers Association reported Wednesday in its Weekly Mortgage Applications Survey for the week ending May 12.
MBA Weekly Survey May 10, 2023: Applications Rise as Rates Drop
Mortgage rates fell modestly last week, and mortgage applicants took advantage, the Mortgage Bankers Association reported Wednesday in its Weekly Mortgage Applications Survey for the week ending May 5.
MBA Weekly Survey May 10, 2023: Applications Rise as Rates Drop
Mortgage rates fell modestly last week, and mortgage applicants took advantage, the Mortgage Bankers Association reported Wednesday in its Weekly Mortgage Applications Survey for the week ending May 5.
April Mortgage Credit Availability Down 1%
Mortgage credit availability fell in April to its lowest level since 2013, the Mortgage Bankers Association reported Tuesday.