
While overall mortgage delinquencies were relatively flat compared to last year, earlier-stage delinquencies declined while serious delinquencies – those loans 90 or more days delinquent or in foreclosure – increased.
Tag: COTW
Chart of the Week: Latest Delinquency Rates and Range Since 1996
Commercial mortgage delinquencies increased across all major capital sources in the first quarter of 2025, according to the Mortgage Bankers Association’s (MBA) latest Commercial Delinquency Report

Chart of the Week: MOVE Volatility Index and Mortgage-Treasury Spread
Market volatility, both in equity and bond markets, increased sharply last week because of the serial surprises with respect to the direction of U.S. tariff policy.

Chart of the Week: Payroll Growth and Unemployment Rate
The August employment report confirmed that the job market is cooling.
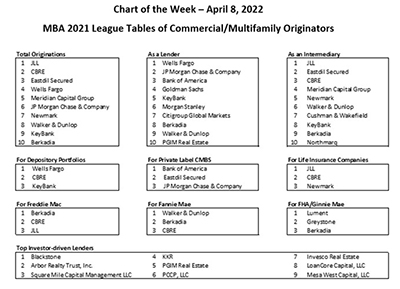
MBA Chart of the Week Apr. 8, 2022: Top Commercial/Multifamily Originators
MBA’s Commercial Real Estate/Multifamily Finance Firms – Annual Origination Volumes annual report presents a comprehensive set of listings of commercial/multifamily mortgage originators, their volumes and the different roles they play.
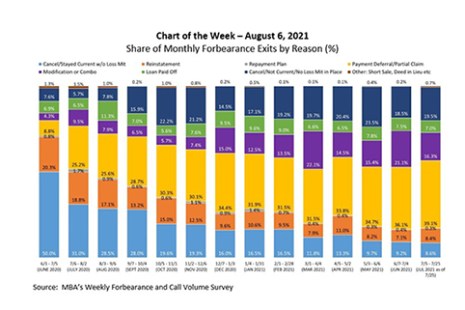
MBA Chart of the Week Aug. 9, 2021: Share of Monthly Forbearance Exits by Reason
According to MBA’s Weekly Forbearance and Call Volume Survey, the share of loans in forbearance dropped to 3.47 percent of servicers’ portfolio volume as of July 25, 2021, from a peak of 8.55 percent as of June 7, 2020. While the number of borrowers exiting forbearance has fluctuated from one month to the next, with the largest number of reported exits in July and October of last year, the post-forbearance outcomes for borrowers have differed.
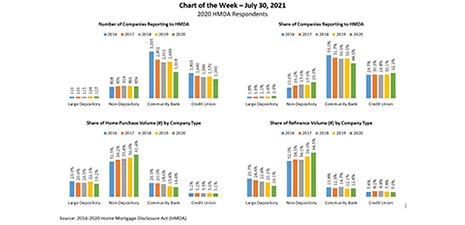
MBA Chart of the Week Aug. 2, 2021: HMDA Respondents
A total of 4,309 companies reported lending activity under the Home Mortgage Disclosure Act in 2020, according to MBA’s own analyses of the dataset.
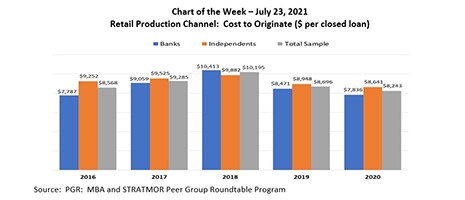
MBA Chart of the Week July 23 2021: Retail Production Channel Cost to Originate
In this week’s MBA Chart of the Week, we focus on the production costs in the retail channel. The cost to originate averaged $8,243 per loan in 2020, a $453 per loan improvement over 2019.
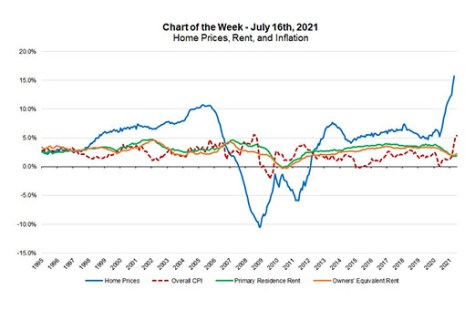
MBA Chart of the Week, July 19, 2021: Home Prices, Rent and Inflation
Federal Reserve Chair Jay Powell testified before Congress last week and received several questions regarding recent inflation trends, with overall CPI inflation increasing 5.4 percent in June 2021 compared to a year ago. This followed readings of 4.2 percent in April and 5.0 percent in May. The headline inflation number was the highest in 13 years, while the recent monthly pace of core inflation is the highest since the early 1980s.
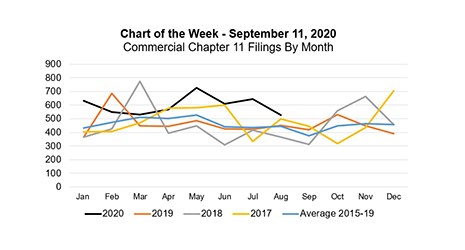
MBA Chart of the Week: Commercial Chapter 11 Filings By Month
As the U.S. economy works its way through the current pandemic and recession, housing has been a clear bright spot in an otherwise dire time. This week’s chart highlights the “V” shaped recovery exhibited by various measures of housing health.