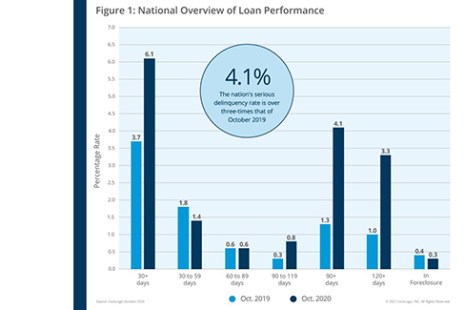
CoreLogic, Irvine, Calif., said on a national level, 6.1% of mortgages were in some stage of delinquency (30 days or more past due, including those in foreclosure) in October, a 2.4-percentage point increase from a year ago, when it was 3.7%.
Tag: Coronavirus
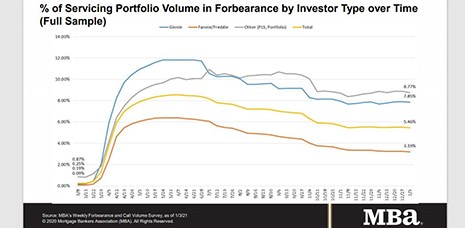
MBA: Share of Loans in Forbearance Drops to 5.46%
The Mortgage Bankers Association’s latest Forbearance and Call Volume Survey reported loans now in forbearance decreased to 5.46% of servicers’ portfolio volume as of Jan. 3 compared to 5.46% the prior week. MBA estimates 2.7 million homeowners are in forbearance plans.
Michael Steer: A New Year, A New Regulatory Attitude?
Should the pandemic regulatory attitude be forgot and never brought to mind? Not exactly. However, lenders can adapt the current pandemic regulatory attitude into one that pays equal mind to both the pandemic and the importance of compliance.
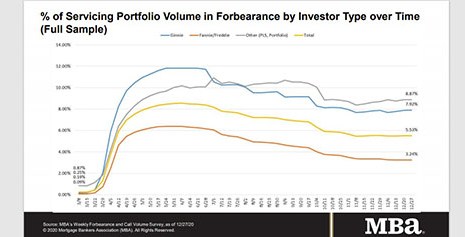
MBA: Share of Mortgage Loans in 2-Month Holding Pattern
The Mortgage Bankers Association’s Forbearance and Call Volume Survey showed little change over the holiday season–and in fact, has shown little change over the past two months.

Mortgage Applications Drop over Holidays
Despite near-record low interest rates, Americans had the holidays in mind and not mortgages, the Mortgage Bankers Association reported this morning in its Weekly Applications Survey for the weeks ending Dec. 25 and Jan. 1.
MBA: Share of Mortgage Loans in 2-Month Holding Pattern
The Mortgage Bankers Association’s Forbearance and Call Volume Survey showed little change over the holiday season–and in fact, has shown little change over the past two months.
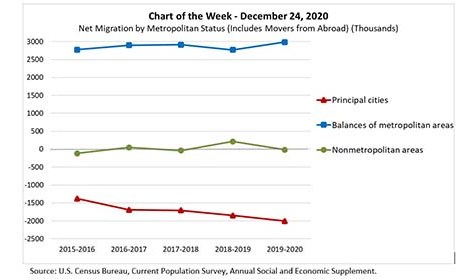
MBA Chart of the Week: Net Migration by Metropolitan Status
This week’s MBA Chart of the Week shows net migration by metropolitan status over the past five years. The green line shows that the net movement into nonmetropolitan areas has hovered around zero, growing by an average of 19,000 migrants (nationally). On the other hand, metropolitan areas absorbed more than 5.7 million migrants over this period.
Mortgage Applications Increase 2nd Straight Week in MBA Weekly Survey
No record-low interest rates this time, but the 30-year fixed rate was low enough to attract another push of refinance applications for the second straight week, the Mortgage Bankers Association reported this morning in its Weekly Mortgage Applications Survey for the week ending December 18.