
According to MBA’s latest Servicing Operations Study and Forum, fully-loaded mortgage servicing costs of performing loans averaged $176 per loan in 2024, while the costs of non-performing loans averaged $1,573 per loan.
Tag: Chart of the Week

Chart of the Week: Average Turn Times for Broker Wholesale & Non-Delegated Correspondent Production Channels
This week’s Chart of the Week details turn times for the broker wholesale and non-delegated correspondent production channels in the first quarter of 2025.

Chart of the Week: SERC Mortgage Credit Risk Index
An updated measure of GSE-eligible credit risk was recently released by the Smith Enterprise Risk Consortium (SERC) at the University of Maryland’s Robert H. Smith School of Business.

Chart of the Week: Four-Quarter House Price Change by State, as of Q1 2025
In the first quarter of 2025, U.S. house prices increased 4% compared to the first quarter of 2024, as reported by the Federal Housing Finance Agency.

Chart of the Week: IMB Pre-Tax Net Production Income by Average Loan Balance in Q1 2025
Independent mortgage banks and mortgage subsidiaries of chartered banks reported a pre-tax net loss of $28 on each loan they originated in the first quarter, according to MBA’s newly released Quarterly Mortgage Bankers Performance Report.
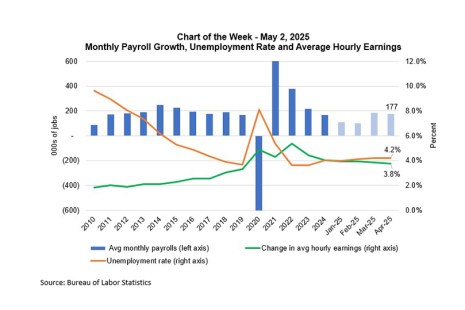
Chart of the Week: Monthly Payroll Growth, Unemployment Rate and Average Hourly Earnings
The April Employment Situation report showed that the job market continues to hold up.

MBA Chart of the Week: Annual Origination Dollar Volume
MBA’s April forecasts and commentary include some sizable updates from our March forecasts as we try to incorporate the net impact of the frequently changing tariff landscape.
Chart of the Week: Commercial and Multifamily Mortgage Debt Outstanding
According to MBA’s Quarterly Mortgage Debt Outstanding Report, total commercial and multifamily mortgage debt outstanding increased by 3.7% year-over-year, rising from $4.62 trillion in Q4 2023 to $4.79 trillion in Q4 2024. This growth reflects continued investment in commercial real estate, with sector-specific variations in debt allocation.
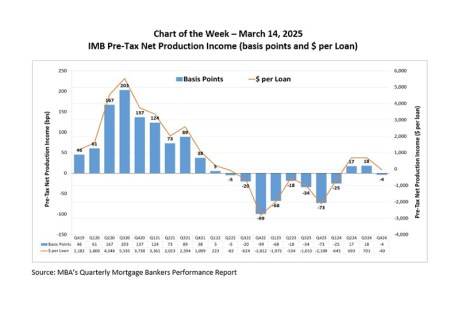
Chart of the Week: IMB Pre-Tax Net Production Income
Independent mortgage banks and mortgage subsidiaries of chartered banks reported a pre-tax net loss of 4 basis points in the fourth quarter, a decrease from the net profit of 18 basis points in the third quarter, MBA’s Quarterly Mortgage Bankers Performance Report found.
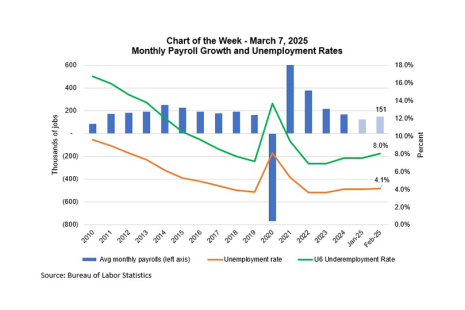
MBA Chart of the Week: Monthly Payroll Growth, Unemployment Rates
The job market softened somewhat in February, with the unemployment rate increasing to 4.1%, the pace of private sector job growth up by 140,000, and wage growth steady at 4%.