MBA: IMB Production Profits Remain Flat in First Quarter

Independent mortgage banks and mortgage subsidiaries of chartered banks reported a pre-tax net production profit of $727 on each loan they originated in the first quarter, compared to a net production profit of $674 per loan in the fourth quarter of 2025, according to MBA’s newest Quarterly Mortgage Bankers Performance Report.
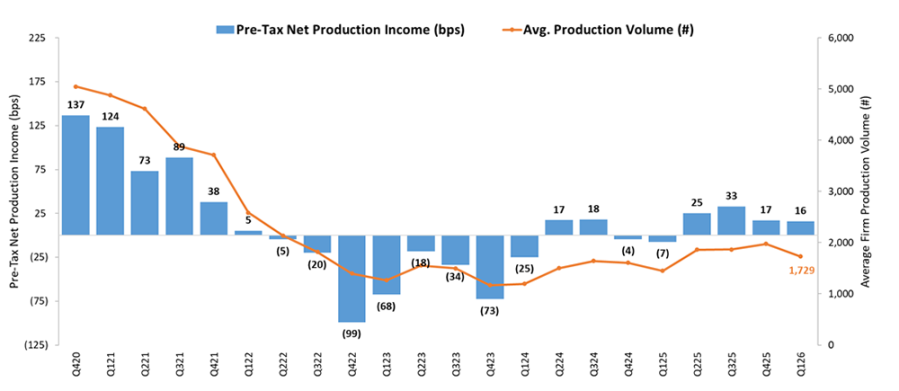
“Average production profits in the first quarter of 2026 remained relatively flat at 16 basis points, despite a decline in production volume from the previous quarter,” said Marina Walsh, CMB, MBA’s vice president of industry analysis. “Production costs grew by close to $800 per loan, but increases in production revenues offset these additional costs.”
Added Walsh, “Servicing net income improved during the first quarter, as markdowns on mortgage servicing rights slowed. Combining both production and servicing business lines, 75 percent of lenders were profitable in the first quarter. Still, disparities between the top and bottom performers remain wide.”
Key Findings of MBA’s First-Quarter 2026 Quarterly Mortgage Bankers Performance Report include:
- The average pre-tax production profit was 16 basis points (bps) in the first quarter of 2026, compared to profit of 17 bps in the fourth quarter of 2025. The average quarterly pre-tax production profit, from the first quarter of 2008 to the most recent quarter, is 39 basis points.
- The average production volume was $621 million per company in the first quarter, down from $643 million per company in the fourth quarter. The volume by count per company averaged 1,729 loans in the first quarter, down from 1,973 loans in the fourth quarter.
- Total production revenue (fee income, net secondary marketing income, and warehouse spread) increased to 353 bps in the first quarter, up from 340 bps in the fourth quarter. On a per-loan basis, production revenues increased to $12,626 per loan in the first quarter, up from $11,776 per loan in the fourth quarter.
- Total loan production expenses – commissions, compensation, occupancy, equipment, and other production expenses and corporate allocations – increased to 336 basis points in the first quarter of 2026 from 323 basis points in the fourth quarter. Per-loan costs increased to $11,898 per loan in the first quarter, up from $11,102 per loan in the fourth quarter. From the first quarter of 2008 to last quarter, loan production expenses have averaged $7,903 per loan.
- The purchase share of first mortgage originations, by dollar volume, was 65 percent. For the mortgage industry as a whole, MBA estimates the purchase share was at 60 percent in the first quarter of 2026.
- The average loan balance for first mortgages increased to $387,881 in the first quarter, up from $379,587 in the fourth quarter. The average loan balance for total mortgages (firsts, seconds, HELOCs, other) increased to $371,648 in the first quarter, up from $362,912 in the fourth quarter.
- Servicing net financial income for the first quarter (without annualizing) was $77 per loan serviced, up from $13 per loan serviced in the fourth quarter. Servicing operating income, which excludes MSR amortization, gains/loss in the valuation of servicing rights net of hedging gains/losses, and gains/losses on the bulk sale of MSRs, was $93 per loan serviced in the first quarter, up from $90 per loan serviced in the fourth quarter.
- Including all business lines (both production and servicing), 76 percent of the firms in the report posted pre-tax net financial profits in the first quarter of 2026, up from 68 percent in the fourth quarter of 2025.
MBA’s Mortgage Bankers Performance Report series offers a variety of other performance measures on the mortgage banking industry including revenue and cost breakouts, productivity, product mixes for originations and servicing volume, and pull-through rates. MBA’s Mortgage Bankers Performance Report is intended as a financial and operational benchmark for independent mortgage companies, bank subsidiaries and other non-depository institutions. Eighty-one percent of the 324 companies that reported production data for the first quarter of 2026 were independent mortgage companies, and the remaining 19 percent were subsidiaries and other non-depository institutions.
There are five Mortgage Bankers Performance Report publications per year: four quarterly reports and one annual report. To purchase or subscribe to the publications, please visit www.mba.org/PerformanceReport. Media wishing to view a copy of either report should contact Falen Pitts at (202) 557-2771 or fpitts@mba.org.