Refinances Surge Nearly 70%, Optimal Blue Reports

(Chart below courtesy of Optimal Blue. Cover photo courtesy of Robert So/pexels.com)
Optimal Blue, Plano, Texas, found a sharp split between purchase and refinance trends as seasonal factors and falling rates reshaped origination activity.
The firm’s August 2025 Market Advantage mortgage data report found that total lock volume dipped about 2% month over month as a roughly 10% drop in purchase locks outweighed the strongest month for rate-and-term refinances this year, which surged nearly 70%.
Non-QM lending also reached a new milestone in August, climbing to a record 8.3% of originations–up from 5.6% a year earlier and just 1.4% in August 2020–extending the steady growth trend first highlighted in last month’s report.
“Borrowers are responding quickly to rate improvements, driving the strongest month for rate-and-term refinances we’ve seen this year,” said Mike Vough, head of corporate strategy at Optimal Blue. “At the same time, purchase activity is beginning its typical seasonal decline, while product mix is shifting with non-QM lending at record levels.”
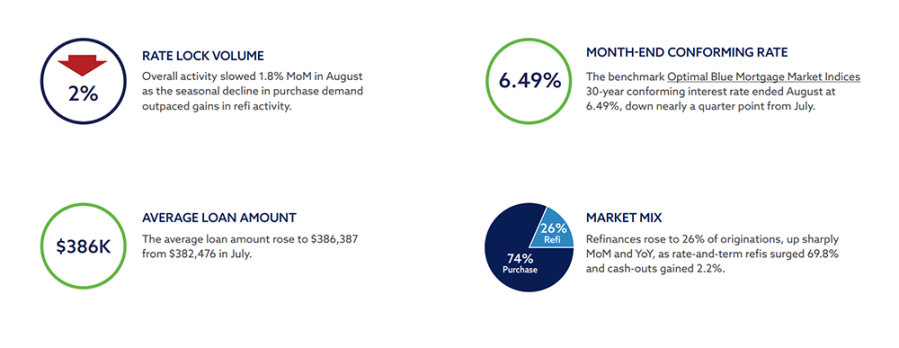
The Optimal Blue Mortgage Market Indices 30-year conforming fixed rate ended August at 6.49%, down nearly a quarter point from July. Jumbo, FHA and VA rates also declined, falling 32, 24 and 33 basis points, respectively.
The report also pointed to significant changes in capital markets execution, with securitization playing a larger role in loan sales. Agency cash window deliveries fell to 24% while agency MBS executions climbed to 40%, highlighting stronger securitization activity among larger lenders.
“This trend underscores how lenders are strategically adapting to optimize execution in order to gain market share,” Vough noted. “We’re seeing deeper engagement in securitization alongside more loans sold to the highest price during loan sales, signaling that capital markets strategies are adjusting to increase profitability.”
Other key findings from the Market Advantage report include:
Volume trends and market composition
• Lock volumes dip: Overall activity slowed 1.8% in August as the seasonal decline in purchase demand outpaced gains in refinance activity.
• Purchase volumes slip: Purchase volume fell 9.8% MoM but remained flat year over year, ushering in the typical post–peak season slowdown.
• Refis surge: Refinances rose to 26% of originations, up sharply MoM and YoY, as rate-and-term refinances surged 69.8% while cash-outs gained 2.2%.
Rates and pricing
• Benchmark rates drop: The Optimal Blue Mortgage Market Indices ended August at 6.49%, down nearly a quarter point from July. Jumbo rates fell 32 bps to 6.57%, FHA decreased 24 bps to 6.26% and VA declined 33 bps to 6.00%, creating opportunities across loan types.
• Pricing strength improves: Loans sold at the highest pricing tier rose to 75%, a 5-point increase, suggesting lenders delivered cleaner loan profiles and captured stronger pricing.
• MSR valuations soften: MSR values dipped to 1.15% for conforming 30-year loans, down 4 bps, in line with lower rates that compressed servicing valuations
Channel and execution
• Cash share declines: Agency cash window sales fell 200 bps to 24% as lenders leaned less on cash executions in favor of strategic delivery methods.
• MBS executions rise: Agency MBS executions climbed to 40%, reflecting increased securitization by larger lenders optimizing capital markets execution and market share.
• Pull-through rates mixed: Purchase pull-through rose 22 bps to 84.2%, while refinance pull-through slipped 15 bps to 61%, indicating some softening in refi pipeline performance.
Product mix and borrower profiles
• Non-QM hits record: Non-QM share rose to 8.34% of all originations in August, up from 8.03% in July and setting a new record high.
• Conforming declines: Conforming share fell 123 bps to 51%. VA loans gained 78 bps to 12.1%, non-conforming increased 48 bps to 17.3%, FHA edged up 1 bp to 19% and USDA dipped 5 bps to 0.7%.
• New build activity softens: Planned-Unit Development lending fell below 28% of production, down more than 4.5% YoY as new construction market share continued to contract.
• FTHB activity steady: First-time homebuyer share held flat for conforming and FHA loans and dipped slightly for VA.
• Borrower profiles remain strong: The average conforming FICO Score was 756, unchanged MoM. Average loan amounts rose to $386,387 from $382,476 in July, ranging from $600,110 in metro New York to $304,511 in Indianapolis. Average LTVs ranged from 73.56 in New York to 81.61 in Indianapolis.
• ARMs hold: Adjustable-rate mortgages accounted for 10.25% of overall lock activity.
Note: the current Optimal Blue Market Advantage podcast features Optimal Blue Chief Technology Officer Seever Sulaiman.